Wolfram Data Repository
Immediate Computable Access to Curated Contributed Data
Estimated mean Body Mass Index (BMI) trend by country
Estimated mean Body Mass Index (BMI) trend between 1975 and 2014 by country.
BMI (kg/m2) estimates are from male/female populations over the age of 18.
(3 columns, 382 rows)
Retrieve the dataset:
| In[1]:= |
| Out[1]= | 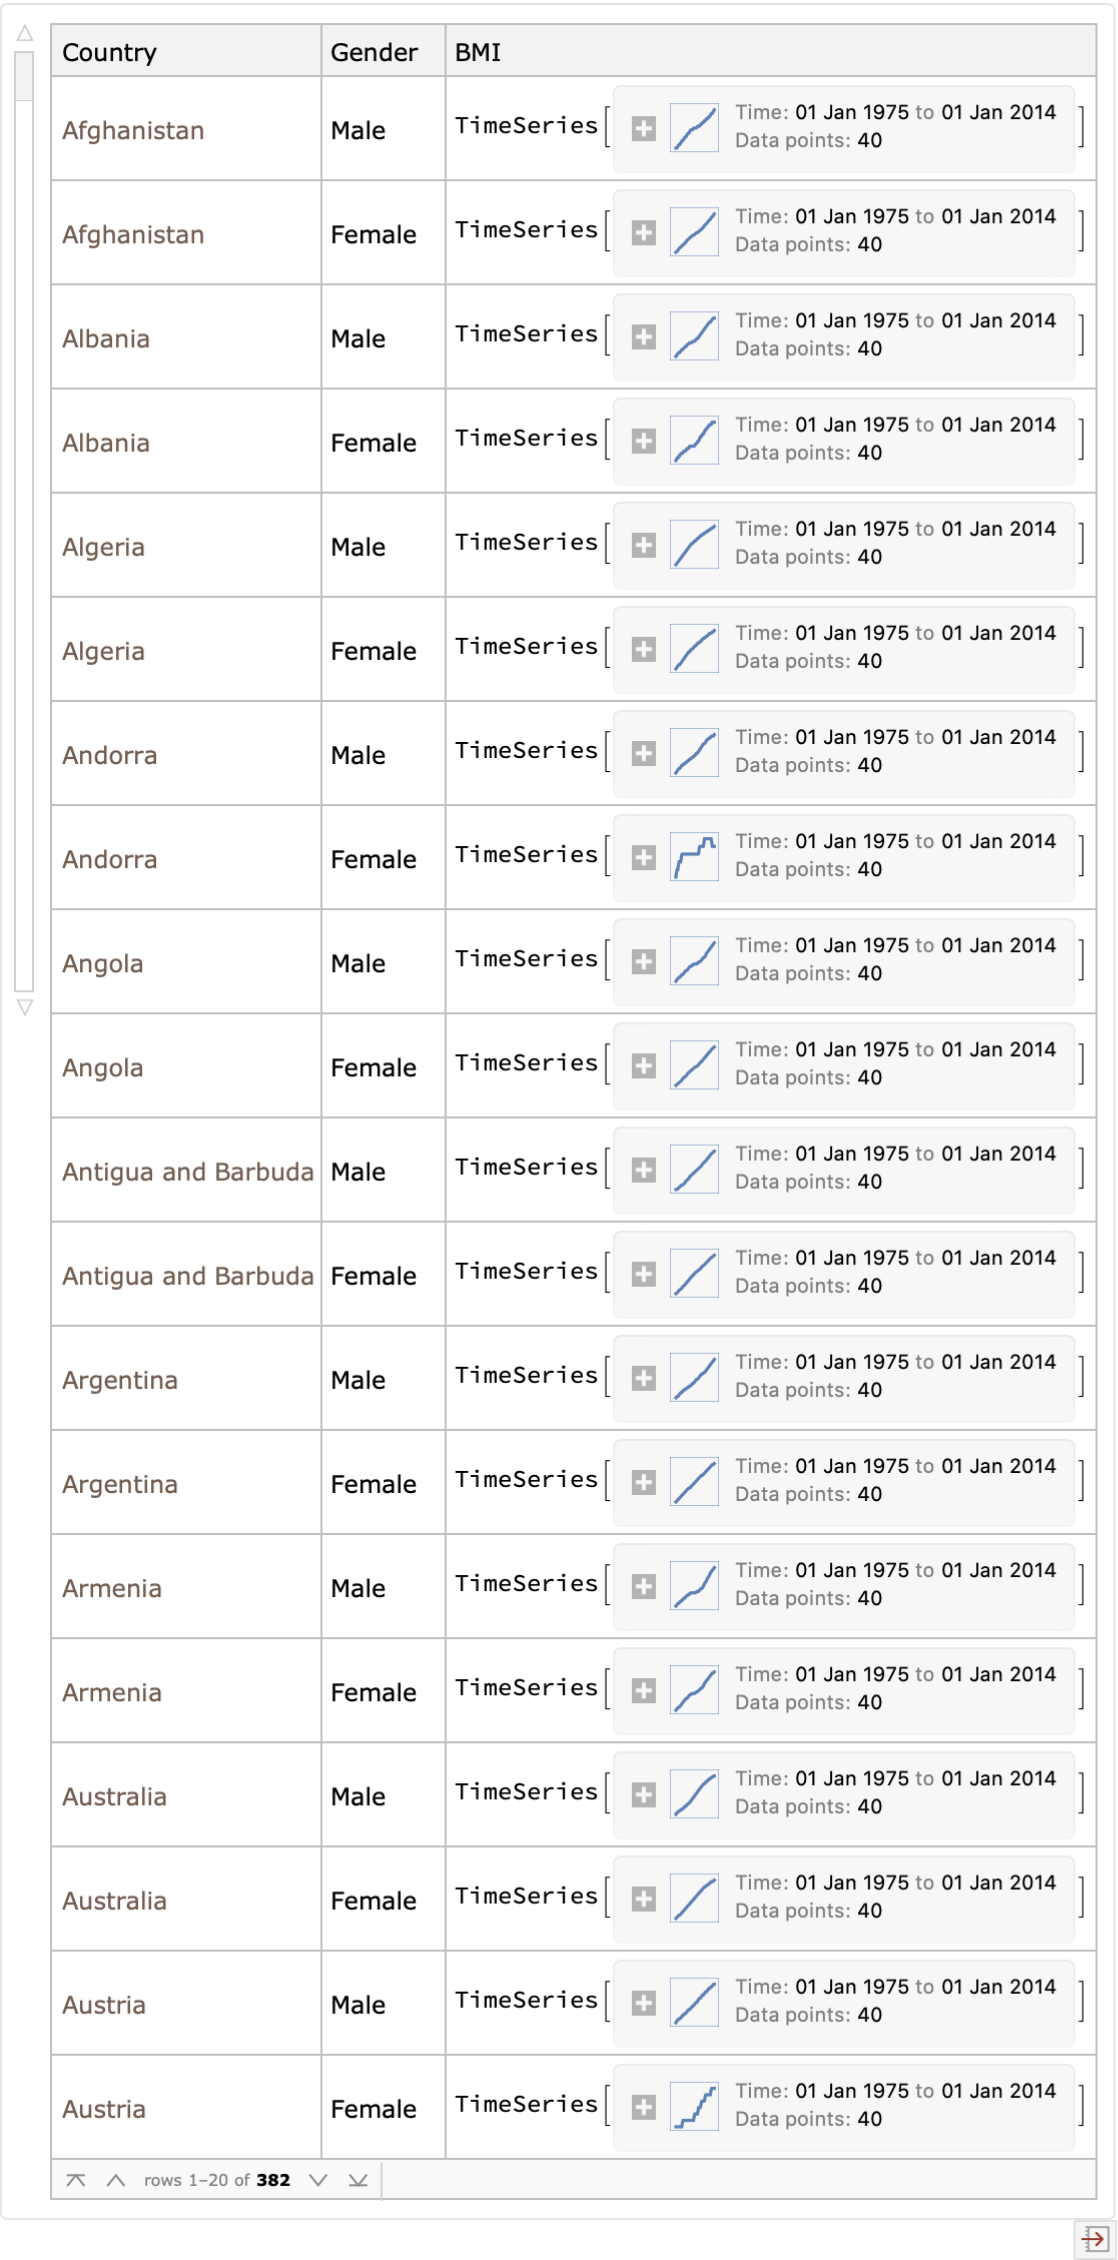 |
Plot estimated BMI of G7 (Group of 7) countries over time:
| In[2]:= | ![With[{data = ResourceData["BMI by Country"], g7 = EntityList@EntityClass["Country", "GroupOf7"]}, DateListPlot[
Legended[#[[3]], #[[1]]] & /@ KeyTake[data[Select[MemberQ[g7, #Country] &]][
All, {"Country", "Gender", "BMI"}][GroupBy["Gender"]], #][[
1]], PlotTheme -> "Business", PlotLabel -> (# <> " estimated BMI"), ImageSize -> 300] & /@ {"Male", "Female"} // Row]](https://www.wolframcloud.com/obj/resourcesystem/images/a97/a97681c3-9eec-48f3-a443-5f010c7e240b/3e2a88a0d681ba86.png) |
| Out[2]= | 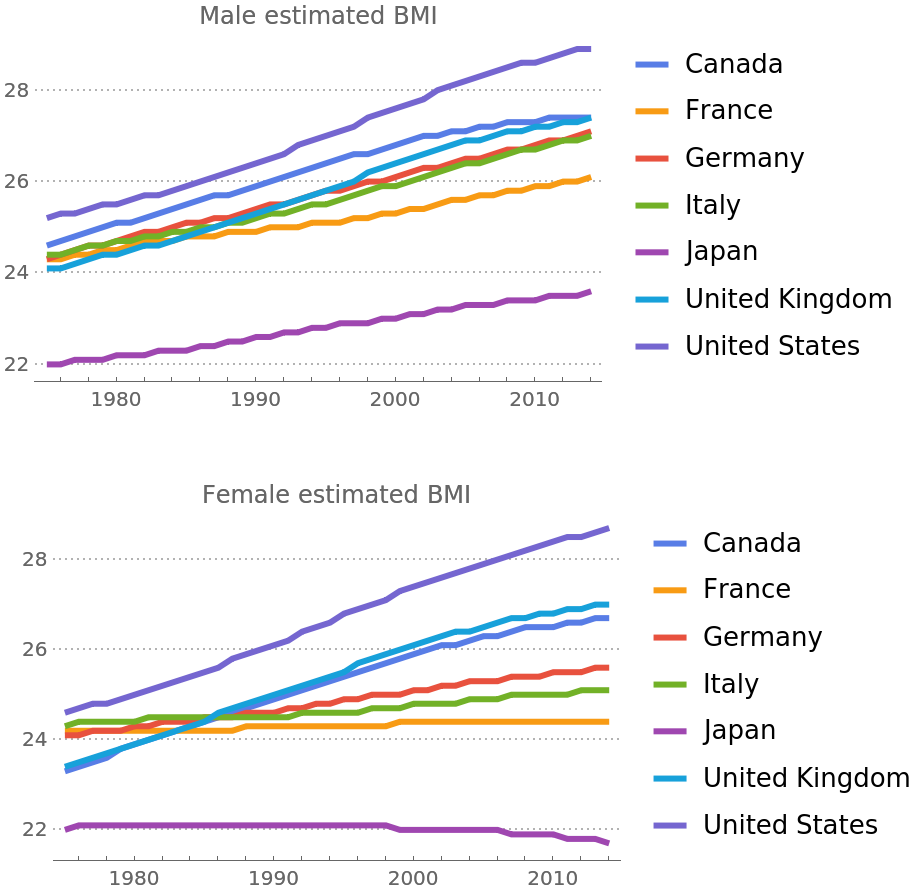 |
Color countries by estimated BMI:
| In[3]:= |
| Out[3]= | 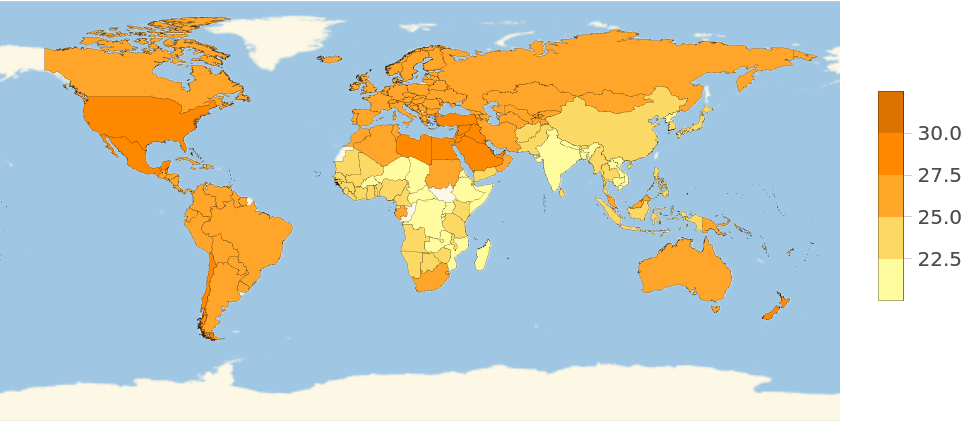 |
Wolfram Research, "BMI by Country" from the Wolfram Data Repository (2017) https://doi.org/10.24097/wolfram.65128.data