Wolfram Data Repository
Immediate Computable Access to Curated Contributed Data
Complete text of State of the Union addresses from 1790 to 2024
Originator: Brad Borevitz
Retrieve the default content:
| In[1]:= |
| Out[1]= | 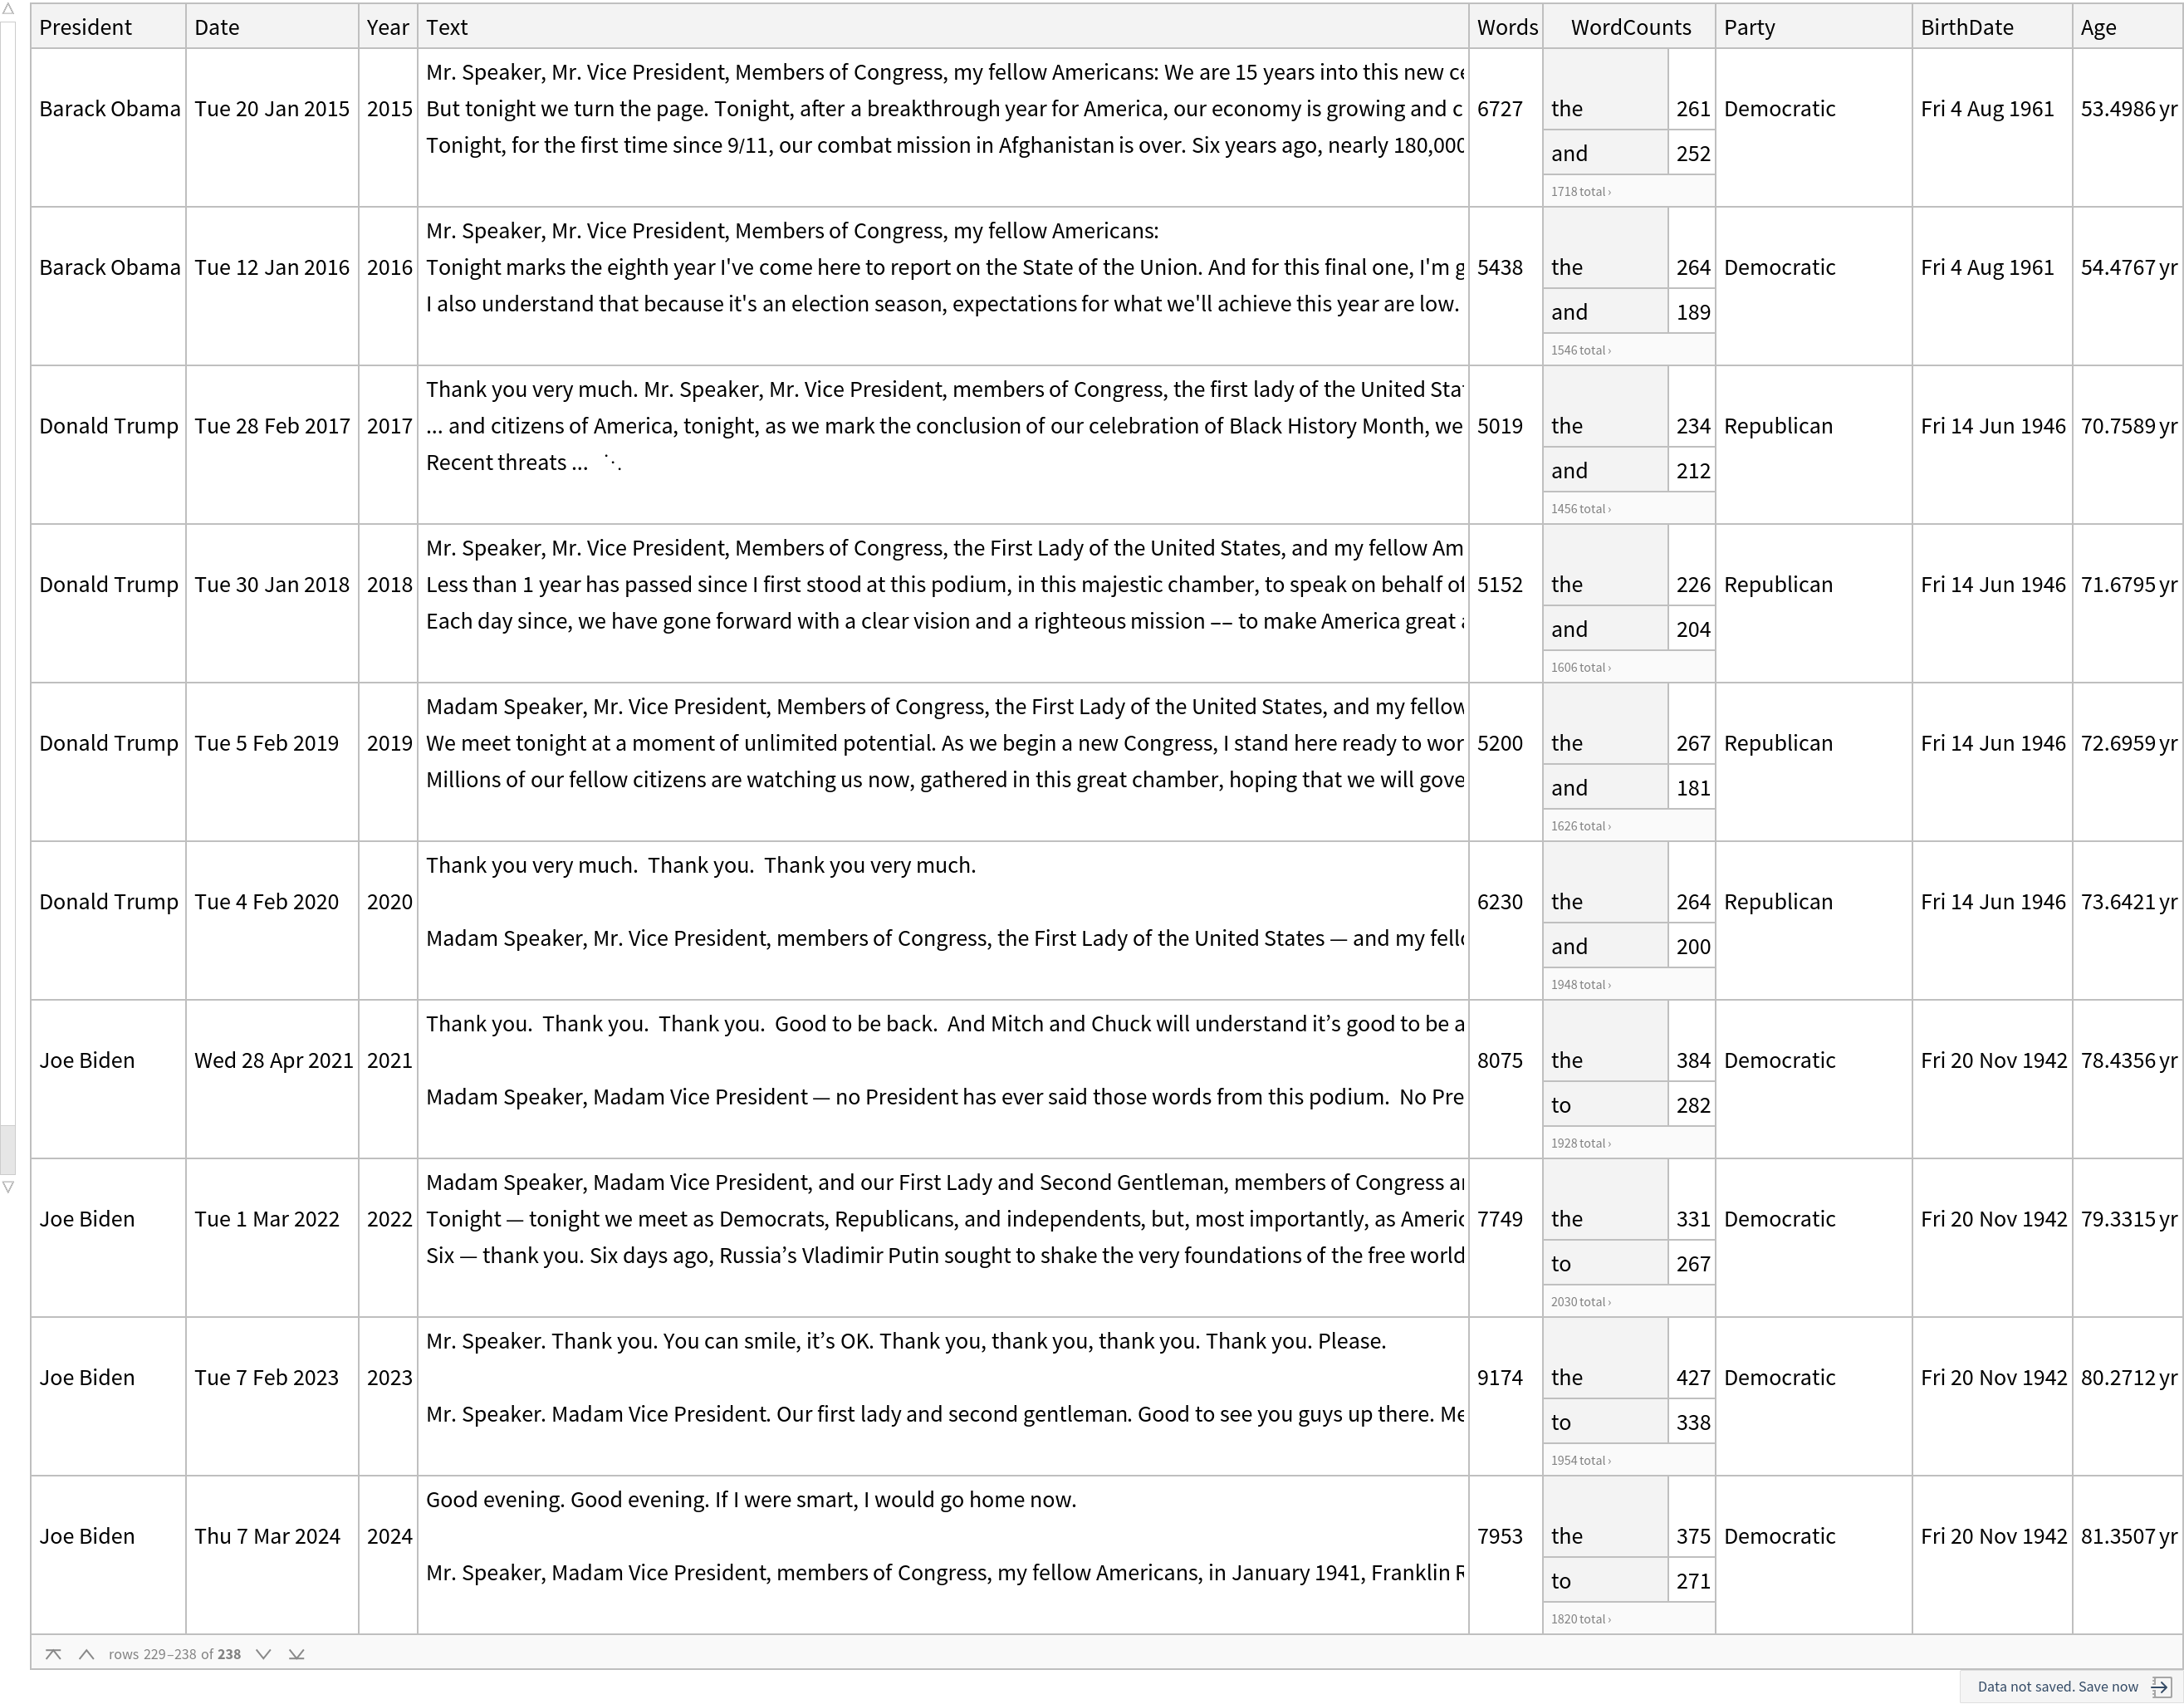 |
Find the longest speeches:
| In[2]:= |
| Out[2]= | 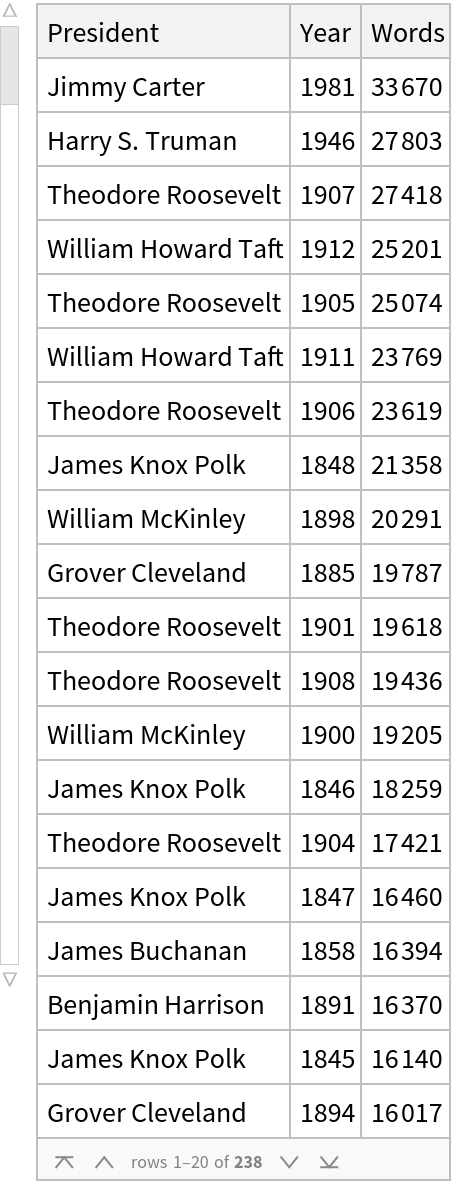 |
Show word counts over time:
| In[3]:= |
| Out[3]= | 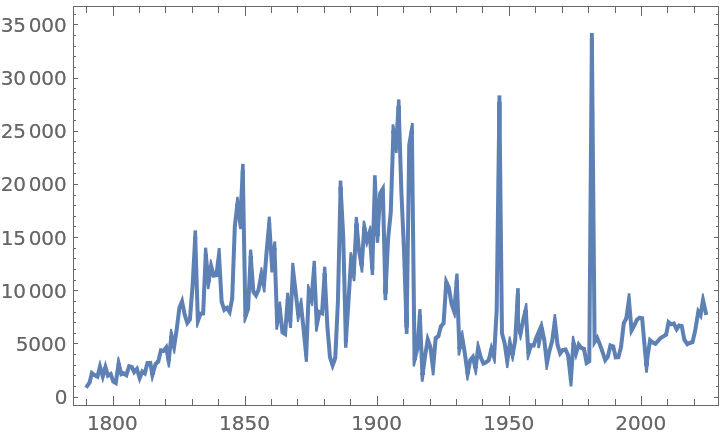 |
Compare word counts for Democratic and Republican presidents:
| In[4]:= | ![With[{partyDates = GroupBy[ResourceData[\!\(\*
TagBox["\"\<State of the Union Addresses\>\"",
#& ,
BoxID -> "ResourceTag-State of the Union Addresses-Input",
AutoDelete->True]\)], #Party &][All, All, {"Date", "Words"}]}, DateListPlot[{Normal@partyDates["Democratic"], Normal@partyDates["Republican"]}, Joined -> False, Filling -> Bottom, PlotLegends -> {"Democratic", "Republican"}]]](https://www.wolframcloud.com/obj/resourcesystem/images/ad0/ad08960b-f43e-4e8f-92bf-04fd17234703/1b26303c30b606b8.png) |
| Out[4]= | 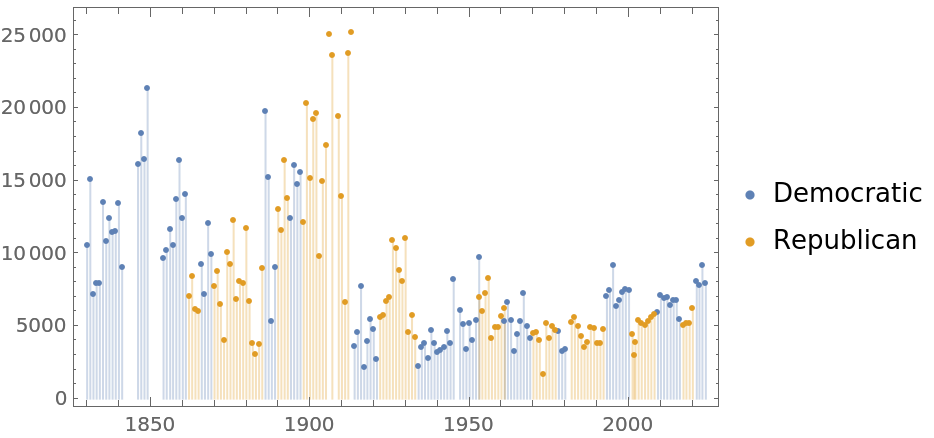 |
Show a distribution of word counts by political party:
| In[5]:= |
| Out[5]= | 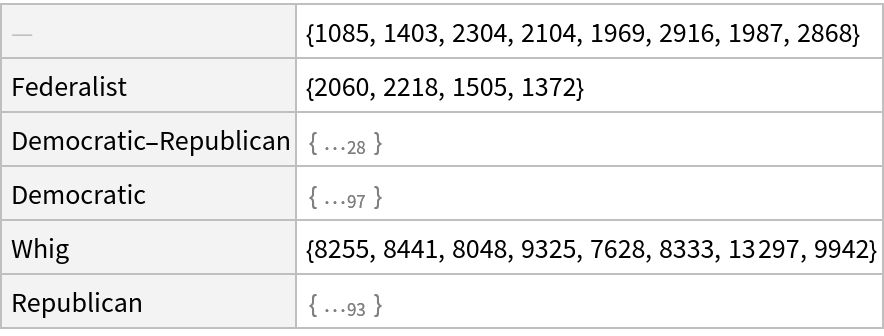 |
| Out[6]= | 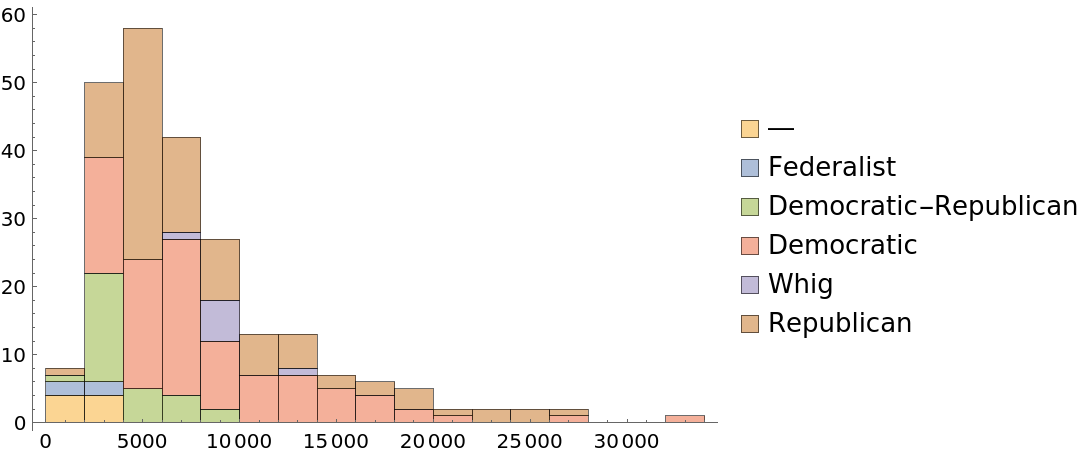 |
Plot median speech lengths by political party:
| In[7]:= | ![BarChart[Median /@ GroupBy[ResourceData[\!\(\*
TagBox["\"\<State of the Union Addresses\>\"",
#& ,
BoxID -> "ResourceTag-State of the Union Addresses-Input",
AutoDelete->True]\)], "Party"][All, All, "Words"], BarOrigin -> Left, ChartLabels -> Automatic]](https://www.wolframcloud.com/obj/resourcesystem/images/ad0/ad08960b-f43e-4e8f-92bf-04fd17234703/299fb92831212012.png) |
| Out[7]= | 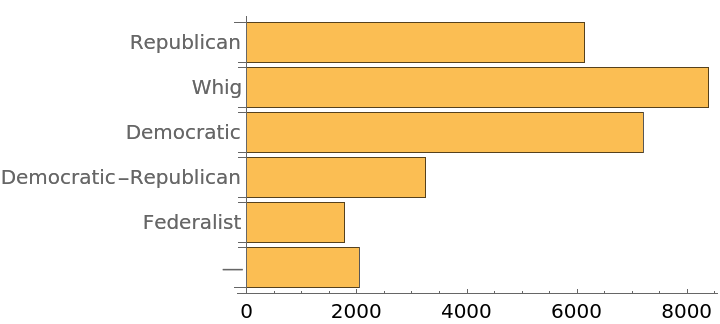 |
Show the frequency of specific words over time:
| In[8]:= | ![Manipulate[DateListPlot[ResourceData[\!\(\*
TagBox["\"\<State of the Union Addresses\>\"",
#& ,
BoxID -> "ResourceTag-State of the Union Addresses-Input",
AutoDelete->True]\)][All, {#Date, #WordCounts[ToString[word]]} &], Joined -> False, Filling -> Bottom], {word, union}]](https://www.wolframcloud.com/obj/resourcesystem/images/ad0/ad08960b-f43e-4e8f-92bf-04fd17234703/6113ce5ee91e18f5.png) |
| Out[8]= | 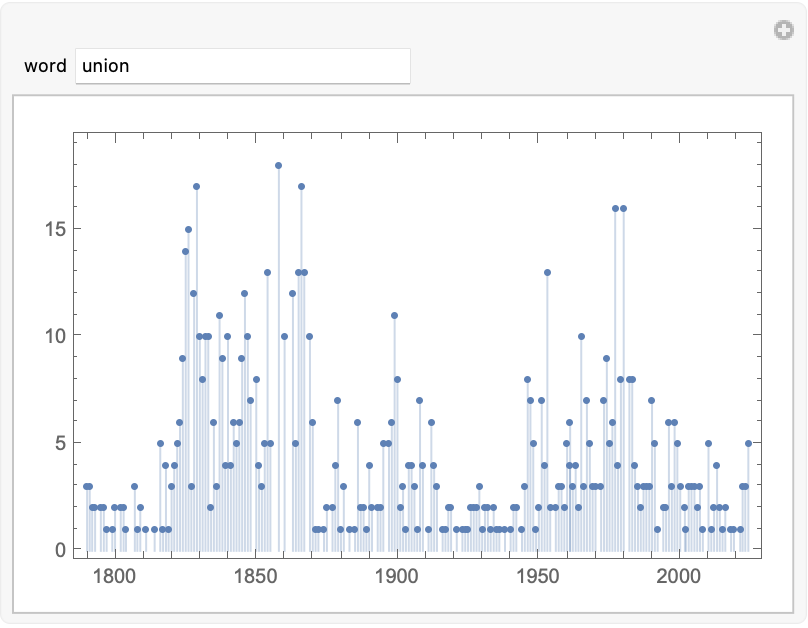 |
| In[9]:= |
| Out[9]= | 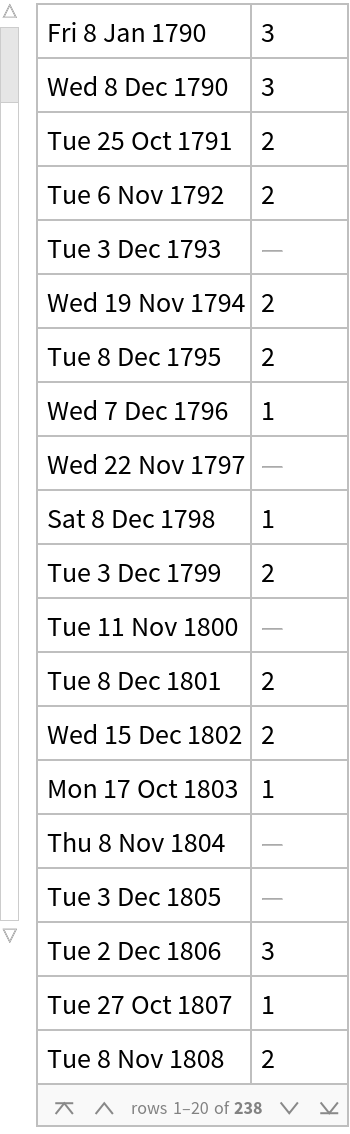 |
Generate a word cloud of a single president's speeches:
| In[10]:= | ![WordCloud[StringJoin@Normal@ResourceData[\!\(\*
TagBox["\"\<State of the Union Addresses\>\"",
#& ,
BoxID -> "ResourceTag-State of the Union Addresses-Input",
AutoDelete->True]\)][
Select[#President == Entity["Person", "FranklinDRoosevelt::xj8jv"] &]][All, "Text"], IgnoreCase -> True]](https://www.wolframcloud.com/obj/resourcesystem/images/ad0/ad08960b-f43e-4e8f-92bf-04fd17234703/0da4c11657eeaea3.png) |
| Out[10]= |  |
Wolfram Research, "State of the Union Addresses" from the Wolfram Data Repository (2024) https://doi.org/10.24097/wolfram.05676.data