Wolfram Data Repository
Immediate Computable Access to Curated Contributed Data
The human protein protein interaction network from The Human Protein Atlas
(11351 vertices, 63088 edges)
The Human Protein Protein Interaction Network:
| In[1]:= |
| Out[1]= |
Data for Version 24.0 can be accessed using:
| In[2]:= |
| Out[2]= |
Visualize the Human Protein Protein Interaction Network:
| In[3]:= |
| Out[4]= | 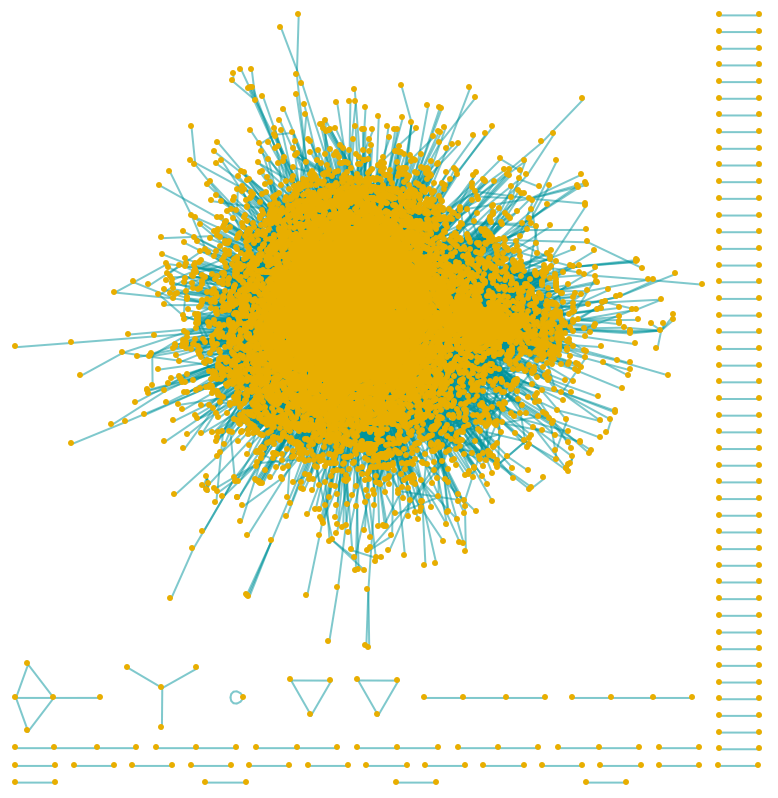 |
Let us visualize the power law distribution of VertexDegree in the Human PPIN, which implies the human PPIN is a scale-free network with a few large hubs:
| In[5]:= | ![exponent = -2;
fit = 5*(#^exponent) & /@ Range[300];
exponent2 = -1;
fit2 = 0.3*(#^exponent2) & /@ Range[200]; ListLogLogPlot[{ResourceFunction[
ResourceObject[<|"Name" -> "VertexDegreeRelativeFrequencies", "ShortName" -> "VertexDegreeRelativeFrequencies", "UUID" -> "a76d6242-2a31-4326-bb6a-df4e446f50a6", "ResourceType" -> "Function", "Version" -> "1.0.0", "Description" -> "Relative frequencies of VertexDegree in a Graph", "RepositoryLocation" -> URL[
"https://www.wolframcloud.com/obj/resourcesystem/api/1.0"], "SymbolName" -> "FunctionRepository`$8f984335e1b840a0b3c49438547b6dc4`VertexDegreeRelativeFrequencies", "FunctionLocation" -> CloudObject[
"https://www.wolframcloud.com/obj/beb446d6-a18b-4eae-b8fa-c7d76afd70c6"]|>, ResourceSystemBase -> Automatic]][humanPPIN], fit, fit2}, AxesLabel -> {"VertexDegree", "Probability"}, ImageSize -> 600, PlotLegends -> {"Data", "x^-2", "x^-1"}]](https://www.wolframcloud.com/obj/resourcesystem/images/b35/b35279e3-9ae2-4ef4-8a35-fd6895b71bd8/604fb3d9018ba772.png) |
| Out[6]= | 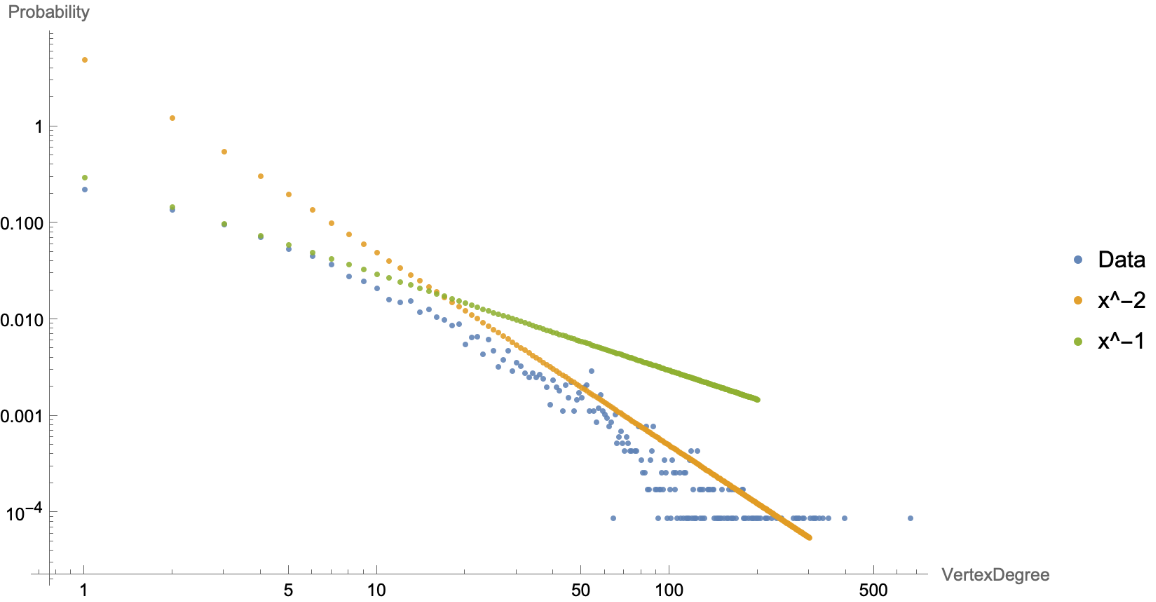 |
Which can be seen if the VertexSize of the nodes are scaled by its VertexDegree:
| In[7]:= |
| Out[7]= | 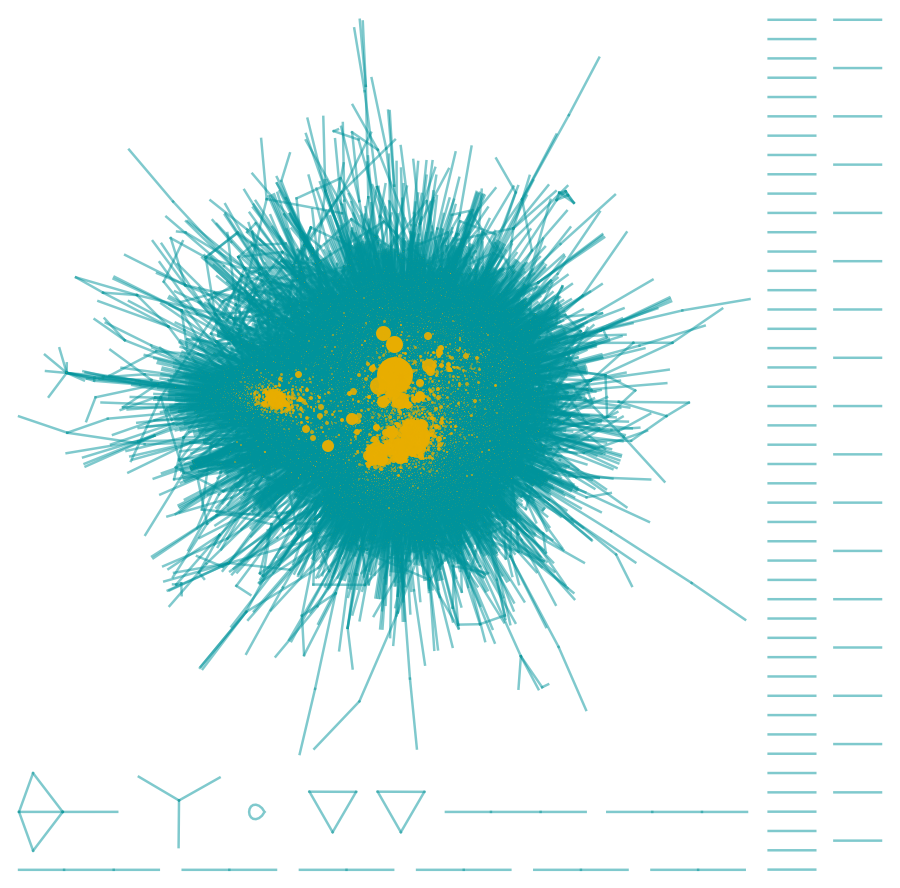 |
A histogram displaying the distribution of degrees for the vertices of the graph, further confirming that the graph is a scale free network:
| In[8]:= | ![humanPPIN = ResourceData[\!\(\*
TagBox["\"\<Human Protein Protein Interaction Network\>\"",
#& ,
BoxID -> "ResourceTag-Human Protein Protein Interaction Network-Input",
AutoDelete->True]\)];
Histogram[VertexDegree[humanPPIN], PlotRange -> All, ScalingFunctions -> "Log", AxesLabel -> {"VertexDegree", "Frequency"}]](https://www.wolframcloud.com/obj/resourcesystem/images/b35/b35279e3-9ae2-4ef4-8a35-fd6895b71bd8/368acdca72584616.png) |
| Out[9]= | 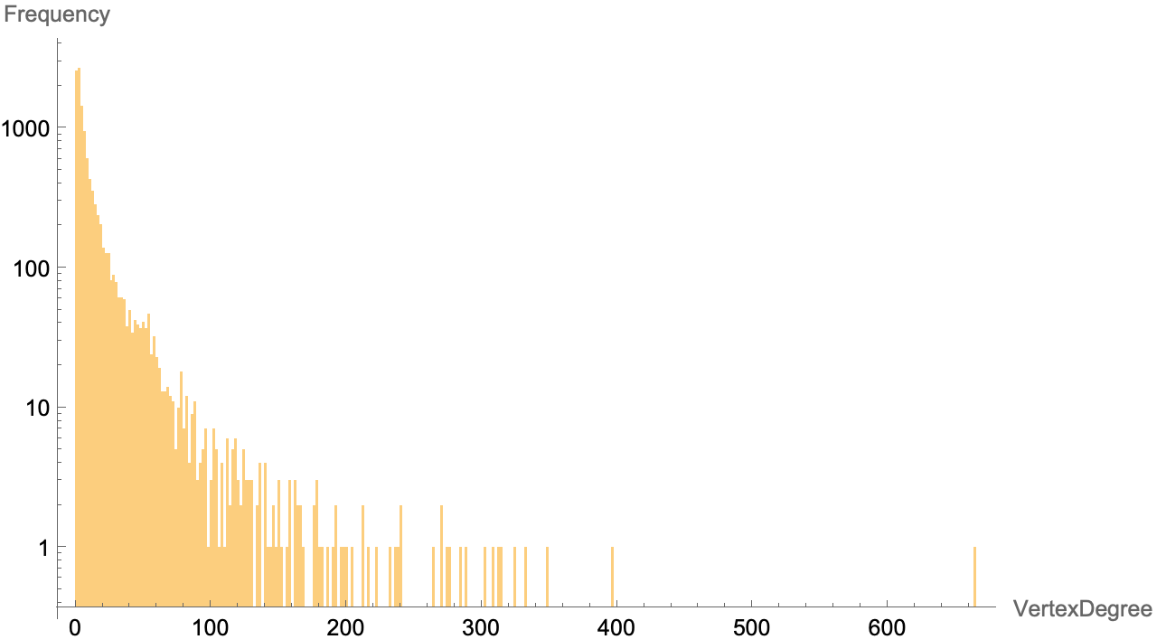 |
A table of the top 25 genes in the human body by degree, showing the behavior of "hubs" and how some genes interact with a large amount of genes:
| In[10]:= | ![graphMeasures = ResourceData[\!\(\*
TagBox["\"\<Human Protein Protein Interaction Network\>\"",
#& ,
BoxID -> "ResourceTag-Human Protein Protein Interaction Network-Input",
AutoDelete->True]\), "Human PPIN Graph measures"];
degreeRanking = ReverseSortBy[Map[#["DegreeCentrality"] &, graphMeasures], First -> Last];
Grid[Table[{Keys[degreeRanking][[i]], degreeRanking[[i]] }, {i, 25}], Frame -> All]](https://www.wolframcloud.com/obj/resourcesystem/images/b35/b35279e3-9ae2-4ef4-8a35-fd6895b71bd8/09955f1f80bb2ff4.png) |
| Out[11]= | 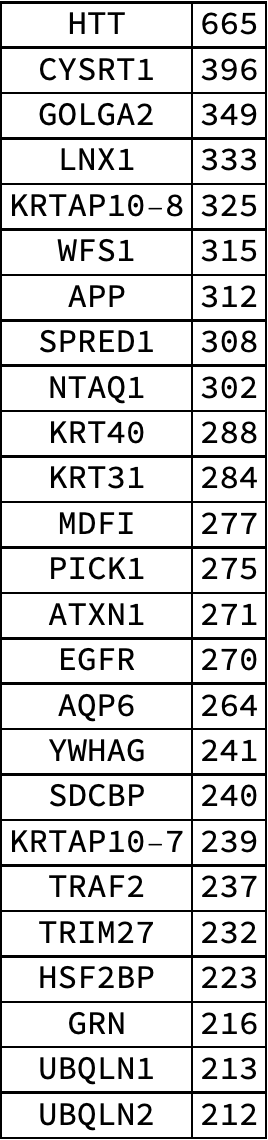 |
Visualizing the most important genes based on different centrality measures of the network:
| In[12]:= | ![fontsize = 20;
GraphicsRow[{WordCloud[Map[#["DegreeCentrality"] &, graphMeasures], PlotLabel -> Style["DegreeCentrality", Black, fontsize], ColorFunction -> "Rainbow", ImageSize -> 500], WordCloud[Map[#["BetweennessCentrality"] &, graphMeasures], PlotLabel -> Style["BetweennessCentrality", Black, fontsize], ColorFunction -> "Rainbow", ImageSize -> 500],
WordCloud[Map[#["EigenvectorCentrality"] &, graphMeasures], PlotLabel -> Style["EigenvectorCentrality", Black, fontsize], ColorFunction -> "Rainbow", ImageSize -> 500]}, ImageSize -> 1000] // EchoTiming](https://www.wolframcloud.com/obj/resourcesystem/images/b35/b35279e3-9ae2-4ef4-8a35-fd6895b71bd8/613ccce84f03c86e.png) |
| Out[12]= | 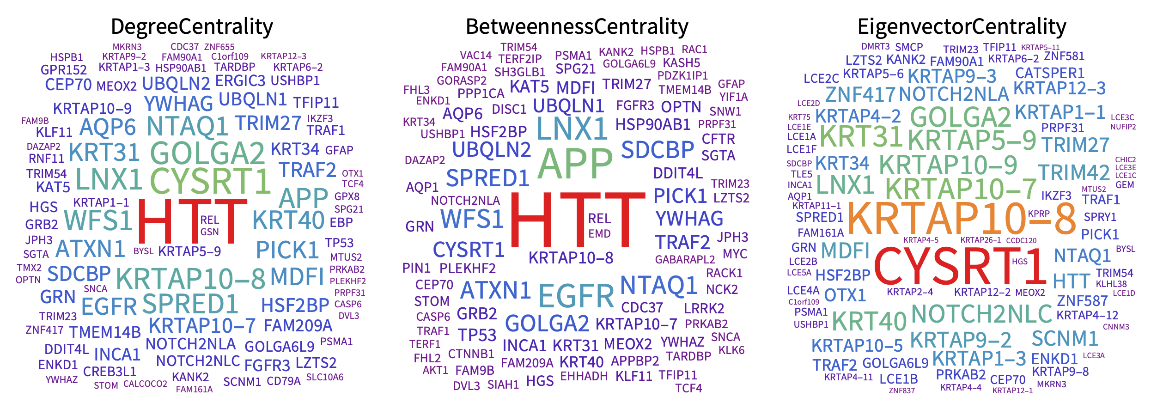 |
A dataset that contains the centrality measures for every single gene:
| In[13]:= | ![graphMeasures = ResourceData[\!\(\*
TagBox["\"\<Human Protein Protein Interaction Network\>\"",
#& ,
BoxID -> "ResourceTag-Human Protein Protein Interaction Network-Input",
AutoDelete->True]\), "Human PPIN Graph measures"];
Dataset@graphMeasures](https://www.wolframcloud.com/obj/resourcesystem/images/b35/b35279e3-9ae2-4ef4-8a35-fd6895b71bd8/107988ded55a796c.png) |
| Out[14]= | 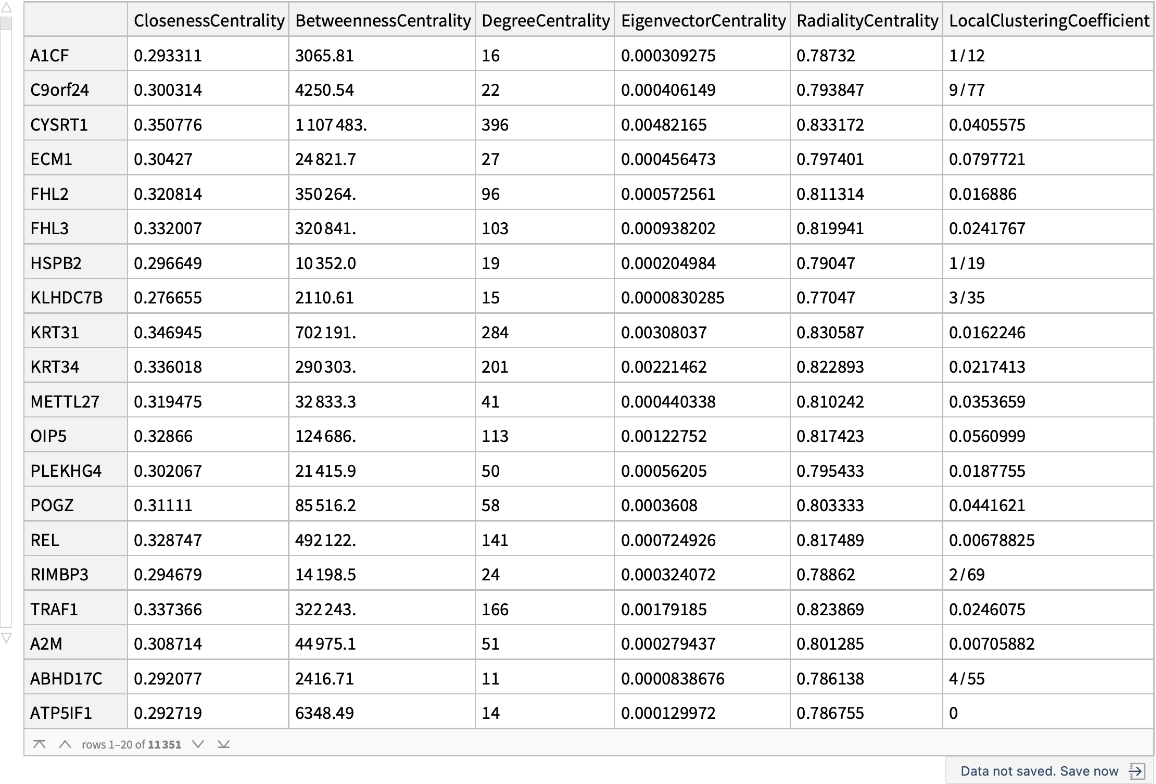 |
A dataset containing the top 1000 genes for each measure:
| In[15]:= | ![measures = {"ClosenessCentrality", "BetweennessCentrality", "DegreeCentrality", "EigenvectorCentrality", "RadialityCentrality", "LocalClusteringCoefficient"}; geneOrdering = Table[ReverseSortBy[Map[#[k] &, graphMeasures], First -> Last], {k, measures}];
n = 1000; Dataset@
AssociationThread[
Table[i, {i, n}] -> MapThread[<|"ClosenessCentrality" -> #1, "BetweennessCentrality" -> #2, "DegreeCentrality" -> #3, "EigenvectorCentrality" -> #4, "RadialityCentrality" -> #5, "LocalClusteringCoefficient" -> #6|> &, ((Keys[#])[[
1 ;; n]]) & /@ geneOrdering]]](https://www.wolframcloud.com/obj/resourcesystem/images/b35/b35279e3-9ae2-4ef4-8a35-fd6895b71bd8/57d70834d8cd15fb.png) |
| Out[16]= | 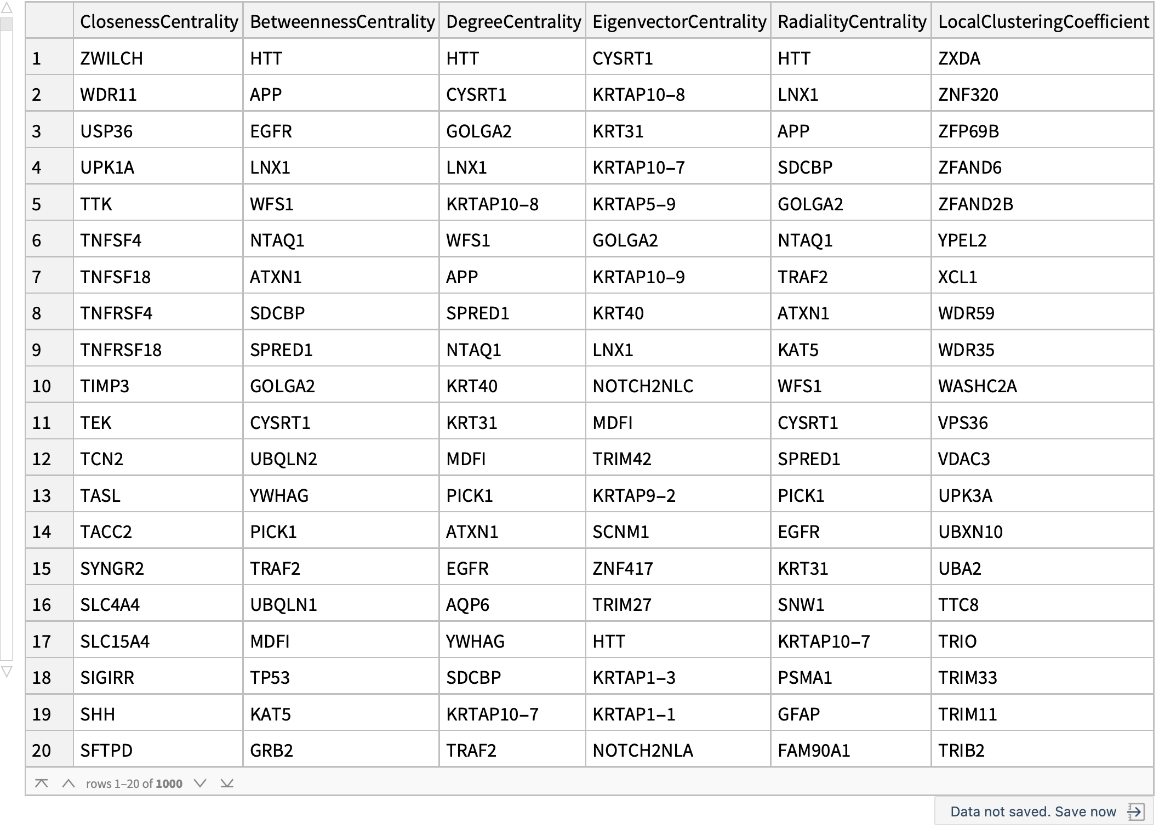 |
WolframChemistry, "Human Protein Protein Interaction Network" from the Wolfram Data Repository (2024)