Wolfram Data Repository
Immediate Computable Access to Curated Contributed Data
An updated and cleaned entity store of the Game of Life wiki website
| "Name" | The name of the pattern |
| "Year" | The year the pattern was first discovered |
| "MatrixData" | The initial pattern in the form of a 2D Sparse Array |
| "Class" | The type of pattern, potential classes include "Oscillator", "Strict still life", "Spaceship" and more |
| "InitialWeight" | The number of black cells in the initial array |
| "Wiki" | URL to the wiki page for this particular pattern |
| "DataFiles" | Name of files on the LifeWiki website. Use the link https://conwaylife.com/patterns/[DataFile] to view the file |
| "Speed" | For gliders and spaceships, this gives the distance the object moves per step |
| In[1]:= |
| Out[1]= | 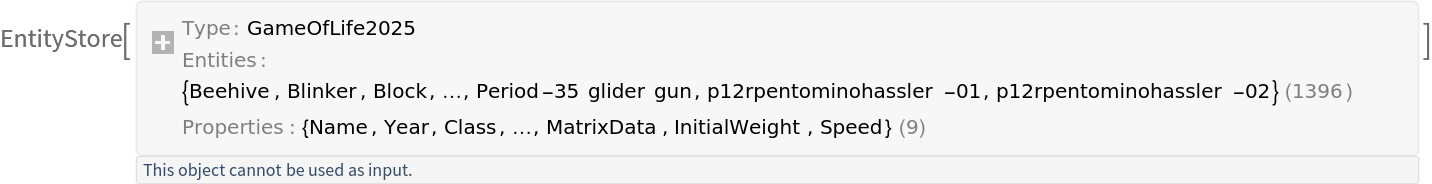 |
Retrieve the EntityStore and register it:
| In[2]:= |
| Out[2]= |
Get properties:
| In[3]:= |
| Out[3]= |
| In[4]:= | ![EntityRegister[ResourceData[\!\(\*
TagBox["\"\<LifeWiki Entity Store 2025\>\"",
#& ,
BoxID -> "ResourceTag-LifeWiki Entity Store 2025-Input",
AutoDelete->True]\)]];
MapAt[ArrayPlot, SortBy[EntityValue[
EntityClass[
"GameOfLife2025", {"Class" -> "Oscillator", "InitialWeight" -> TakeSmallest[5]}], {"Period", "InitialWeight",
"MatrixData", "Year"}, "Dataset"], #InitialWeight &], {All, Key["MatrixData"]}]](https://www.wolframcloud.com/obj/resourcesystem/images/b5b/b5bc382c-bfda-4dd1-9c86-8953db71a35e/0e135baf46a5403f.png) |
| Out[4]= | 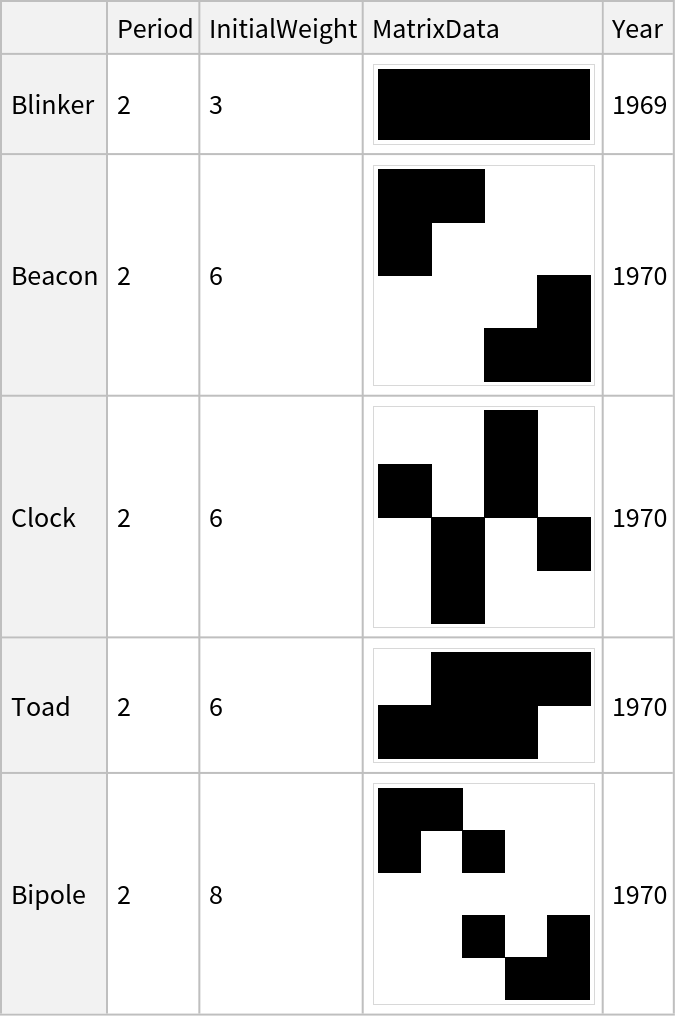 |
| In[5]:= | ![MapAt[ArrayPlot, SortBy[EntityValue[
EntityClass[
"GameOfLife2025", {"Class" -> "Spaceship", "InitialWeight" -> TakeSmallest[5]}], {"Period", "InitialWeight",
"MatrixData", "Year"}, "Dataset"], #InitialWeight &], {All, Key["MatrixData"]}]](https://www.wolframcloud.com/obj/resourcesystem/images/b5b/b5bc382c-bfda-4dd1-9c86-8953db71a35e/34c61bd6c68ce4d4.png) |
| Out[5]= | 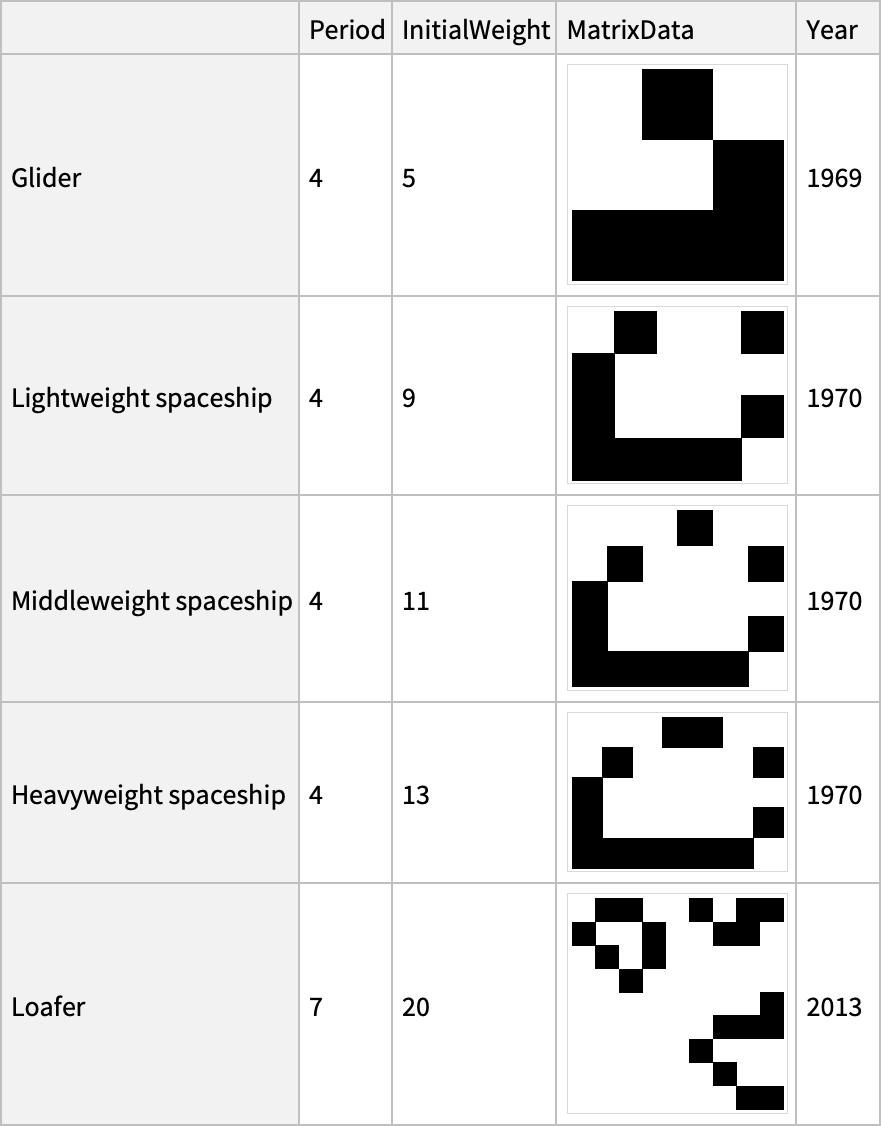 |
Group by class:
| In[6]:= |
| Out[6]= | 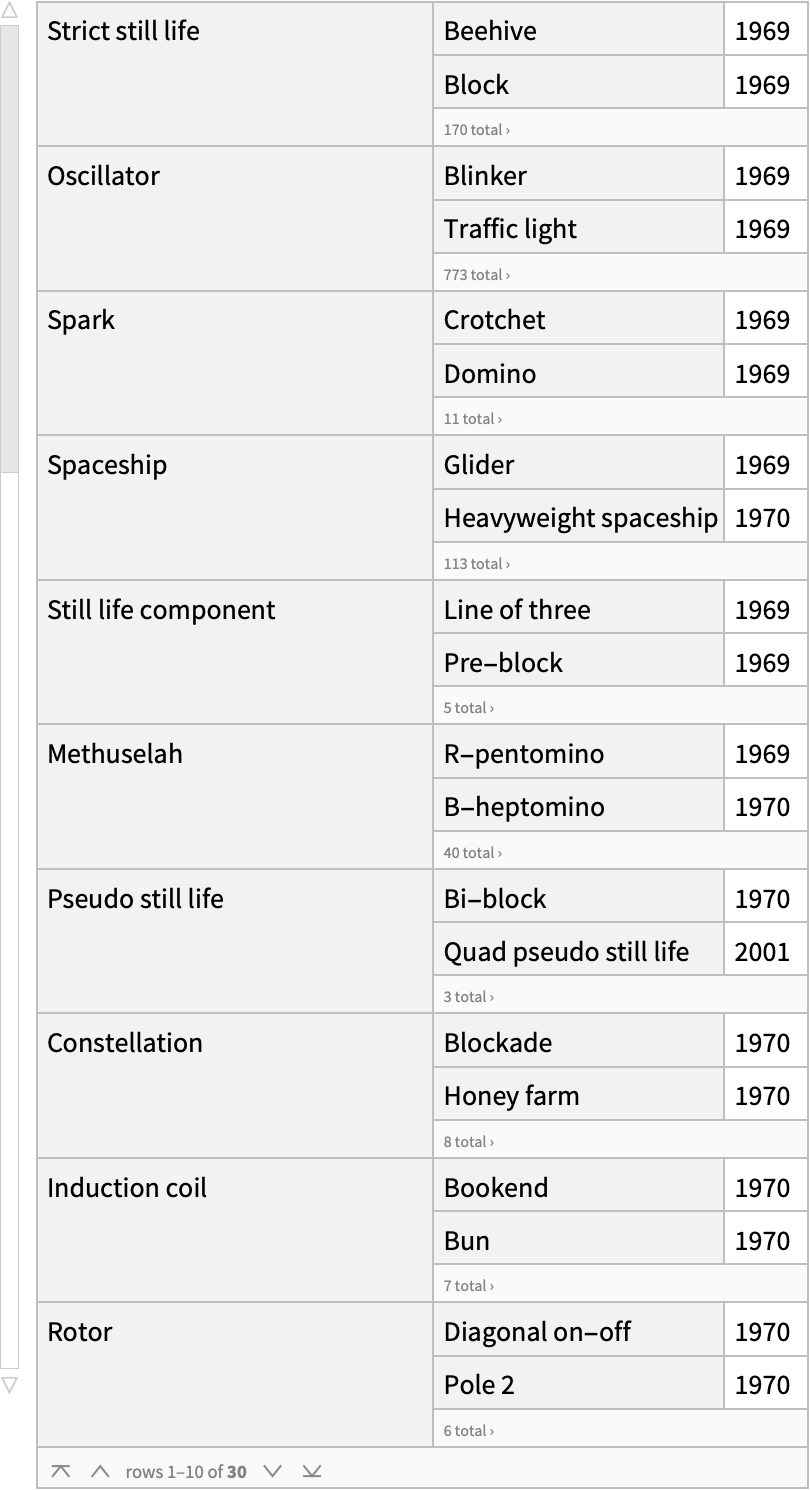 |
See the pattern:
| In[7]:= | ![EntityRegister[ResourceData[\!\(\*
TagBox["\"\<LifeWiki Entity Store 2025\>\"",
#& ,
BoxID -> "ResourceTag-LifeWiki Entity Store 2025-Input",
AutoDelete->True]\)]];
ArrayPlot[
First[EntityValue[
EntityClass["GameOfLife2025", "Name" -> EqualTo["Gosper glider gun"]],
"MatrixData"]]]](https://www.wolframcloud.com/obj/resourcesystem/images/b5b/b5bc382c-bfda-4dd1-9c86-8953db71a35e/49482f502a3b9f07.png) |
| Out[7]= |  |
| In[8]:= | ![Options[CellularAutomatonHistoryPlot] = {Mesh -> True, MeshStyle -> Opacity[.1], ColorRules -> {-1 -> Black, x_ /; x != -1 :> Blend[RGBColor /@ {Hue[0., 0., 1.], Hue[0.12, 0.43, 0.98], Hue[
0.12, 1, 0.99]}, x]}, "Decay" -> .8, "Margin" -> 1};
CellularAutomatonHistoryPlot[rule_, init_, t_, opts___] := Module[{allops = Merge[{Options[CellularAutomatonHistoryPlot], opts}, Last]}, ArrayPlot[
With[{u = ArrayPad[#, allops["Margin"]] & /@ CellularAutomaton[rule, init, t]}, MapThread[
If[#2 == 1, -1, #] &, {Fold[allops["Decay"] # + #2 &, u], Last[u]},
2]], Sequence @@ FilterRules[Normal@allops, Options[ArrayPlot]]]]
CellularAutomatonHistoryPlot["GameOfLife", {First[
EntityValue[
EntityClass["GameOfLife2025", "Name" -> EqualTo["Gosper glider gun"]], "MatrixData"]], 0}, 150,
ImageSize -> 260]](https://www.wolframcloud.com/obj/resourcesystem/images/b5b/b5bc382c-bfda-4dd1-9c86-8953db71a35e/07b84a00e6117483.png) |
| Out[9]= | 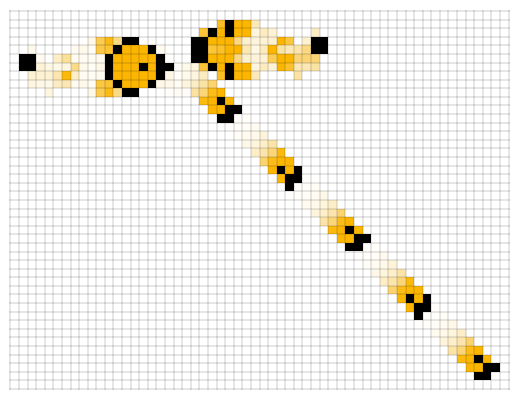 |
| In[10]:= | ![CellularAutomatonPlot3D[rule_, init_, t_, opts___] := ArrayPlot3D[CellularAutomaton[rule, init, t], opts, ColorFunction -> (If[# == 1, SetAlphaChannel[RGBColor[1., 0.6436, 0.03622], 1], Transparent] &), ColorFunctionScaling -> False, ImageSize -> 500, Mesh -> None, MeshStyle -> Opacity[.3]]
CellularAutomatonPlot3D["GameOfLife", {First[
EntityValue[
EntityClass["GameOfLife2025", "Name" -> EqualTo["Gosper glider gun"]], "MatrixData"]], 0}, 100,
ImageSize -> 140, ViewPoint -> {-2.198487002413733`, -2.3413385931086927`, 1.0652645176845457`}]](https://www.wolframcloud.com/obj/resourcesystem/images/b5b/b5bc382c-bfda-4dd1-9c86-8953db71a35e/64504fe7905db399.png) |
| Out[11]= | 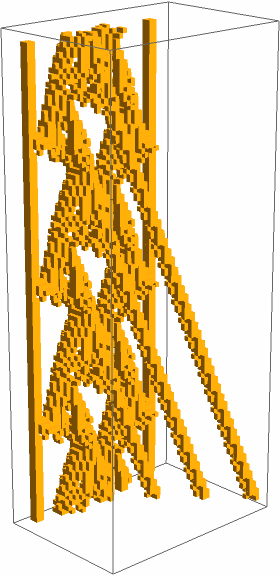 |
| In[12]:= | ![CellularAutomatonSpacetimePlot[rule_, init_, t_, opts___] := Module[{allops = Merge[{Mesh -> True, MeshStyle -> Opacity[.1], ColorRules -> {-1 -> Black, x_ /; x != -1 :> Blend[RGBColor /@ {Hue[0., 0., 1.], Hue[0.12, 0.43, 0.98], Hue[0.12, 1, 0.99]}, x]}, opts}, Last]}, ArrayPlot[
With[{u = Transpose@CellularAutomaton[rule, init, t]}, MapThread[
If[#2 == 1, -1, #] &, {Fold[allops["Decay"] # + #2 &, u], Last[u]},
2]], Sequence @@ FilterRules[Normal@allops, Options[ArrayPlot]]]]
CellularAutomatonSpacetimePlot["GameOfLife", {First[
EntityValue[
EntityClass["GameOfLife2025", "Name" -> EqualTo["Gosper glider gun"]], "MatrixData"]], 0}, 150,
"Decay" -> .99, ImageSize -> 95, Mesh -> None]](https://www.wolframcloud.com/obj/resourcesystem/images/b5b/b5bc382c-bfda-4dd1-9c86-8953db71a35e/1b7ce311b922bd5d.png) |
| Out[14]= | 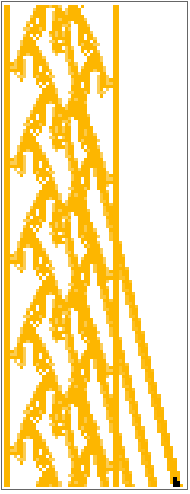 |
See the accumulation of discoveries in different classes over time:
| In[15]:= | ![With[{d = EntityValue[
EntityClass["GameOfLife2025", All], {"Class", "Period", "InitialWeight", "MatrixData", "Year"}, "Association"]}, Module[{topclasses = Keys[TakeLargest[CountsBy[Values[d], #Class &], 5]]}, vals = Accumulate[#]/Total[#, 2] &[
Table[Lookup[#, i, Table[0, 5]] &[
Lookup[CountsBy[#, #Class &], topclasses, 0] & /@ GroupBy[Values[d], #Year &]], {i, 1969, 2025}]]; BarChart[vals, ChartLayout -> "Stacked", ChartStyle -> "Pastel", FrameTicks -> {Automatic, {Table[{i, i + 1967}, {i, 3, 57, 10}], Automatic}}, Frame -> True, ChartLegends -> topclasses, FrameLabel -> {None, "relative number of patterns"}, AspectRatio -> .4]]]](https://www.wolframcloud.com/obj/resourcesystem/images/b5b/b5bc382c-bfda-4dd1-9c86-8953db71a35e/24cabc9471647709.png) |
| Out[15]= | 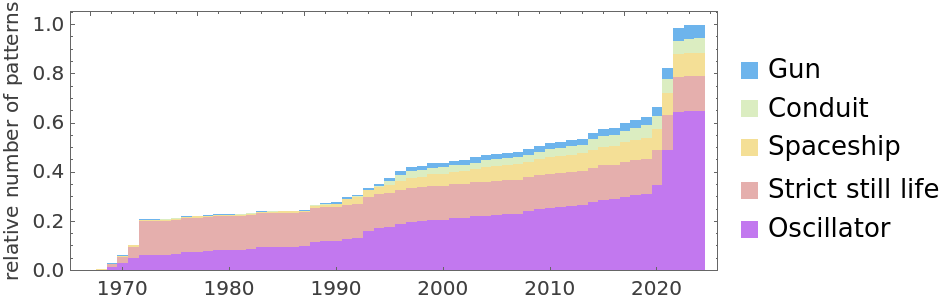 |
View the size and number of discoveries by decade:
| In[16]:= | ![With[{d = EntityValue[
EntityClass["GameOfLife2025", All], {"Class", "Period", "InitialWeight", "MatrixData", "Year"}, "Association"]}, Module[{}, bw = ReverseSortBy[#, #InitialWeight &] & /@ GroupBy[Values[d], Round[#Year, 10] &]; bubs = MapIndexed[{#2[[1, 1]], #2[[2]], #InitialWeight} &, bw, {2}];
BubbleChart[Values[bubs], ChartElements -> Graphics[Rectangle[]], FrameLabel -> {None, "number of patterns"}, AspectRatio -> .4]]]](https://www.wolframcloud.com/obj/resourcesystem/images/b5b/b5bc382c-bfda-4dd1-9c86-8953db71a35e/2471644957d6e6ee.png) |
| Out[16]= | 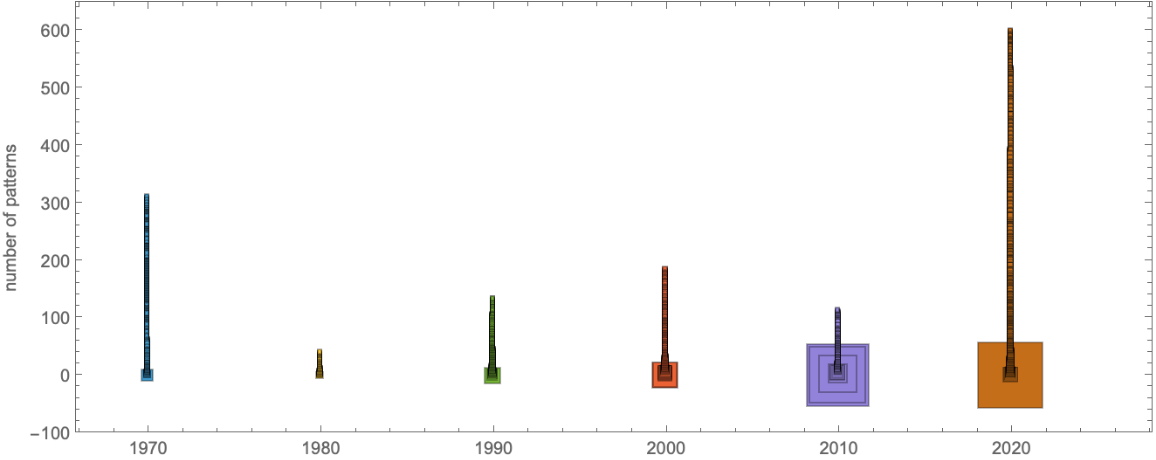 |
See the decreases in different periods over time:
| In[17]:= | ![d = EntityValue[
EntityClass["GameOfLife2025", All], {"Class", "Period", "InitialWeight", "MatrixData", "Year"}, "Association"];
byp = SortBy[(SortBy[#, #Year &] & /@ GatherBy[
Values[Select[
d, #Class === "Oscillator" && KeyExistsQ[#, "Period"] && 1 <= #[["Period"]] < 60 &]], #Period &]), #[[1, "Period"]] &];
allis = Discard[
DeleteDuplicates[
FoldList[
Function[{min, next}, If[Times @@ Dimensions[next["MatrixData"]] < Times @@ Dimensions[min["MatrixData"]], next, min]], #]] & /@
byp, Length[#] == 1 &];
ListLinePlot[
MapIndexed[{#Year, Times @@ Dimensions[#MatrixData]} &, allis, {2}], ScalingFunctions -> "Log", Mesh -> All, Frame -> True, FrameLabel -> {None, "Size of pattern"}, AspectRatio -> .4]](https://www.wolframcloud.com/obj/resourcesystem/images/b5b/b5bc382c-bfda-4dd1-9c86-8953db71a35e/7f56e2a551786f7a.png) |
| Out[18]= | 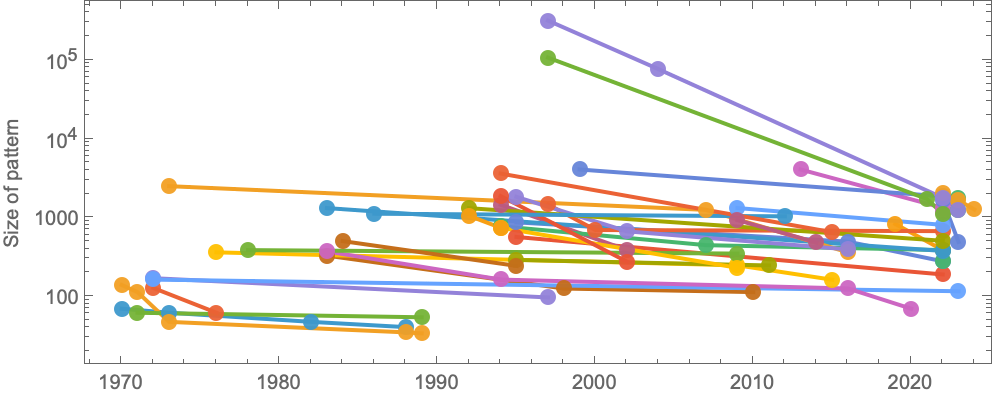 |
Frequency as a function of size:
| In[19]:= | ![d = EntityValue[
EntityClass["GameOfLife2025", All], {"Class", "Period", "InitialWeight", "MatrixData", "Year"}, "Association"];
iws = ReverseSort[CountsBy[Values[d], #InitialWeight &]];
ListLogLogPlot[iws, PlotRange -> All, Frame -> True, FrameLabel -> {"frequency", "size"}, AspectRatio -> .4]](https://www.wolframcloud.com/obj/resourcesystem/images/b5b/b5bc382c-bfda-4dd1-9c86-8953db71a35e/60677a2f1ab56a2e.png) |
| Out[20]= | 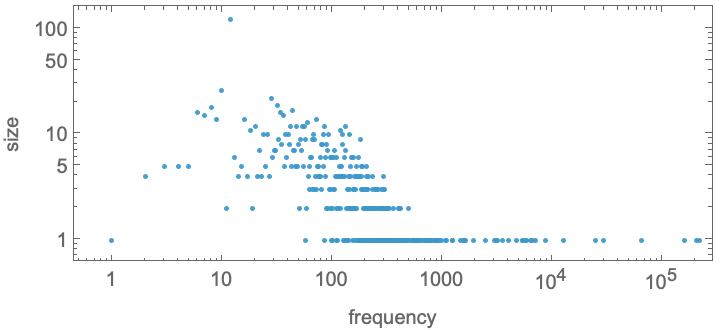 |
Wolfram Research, "LifeWiki Entity Store 2025" from the Wolfram Data Repository (2025)