Wolfram Data Repository
Immediate Computable Access to Curated Contributed Data
Line transect of soil in Gilgai territory
Originator: R. Webster
(9 columns, 365 rows)
Retrieve the ResourceObject:
| In[1]:= |
| Out[1]= |  |
View the data:
| In[2]:= |
| Out[2]= | 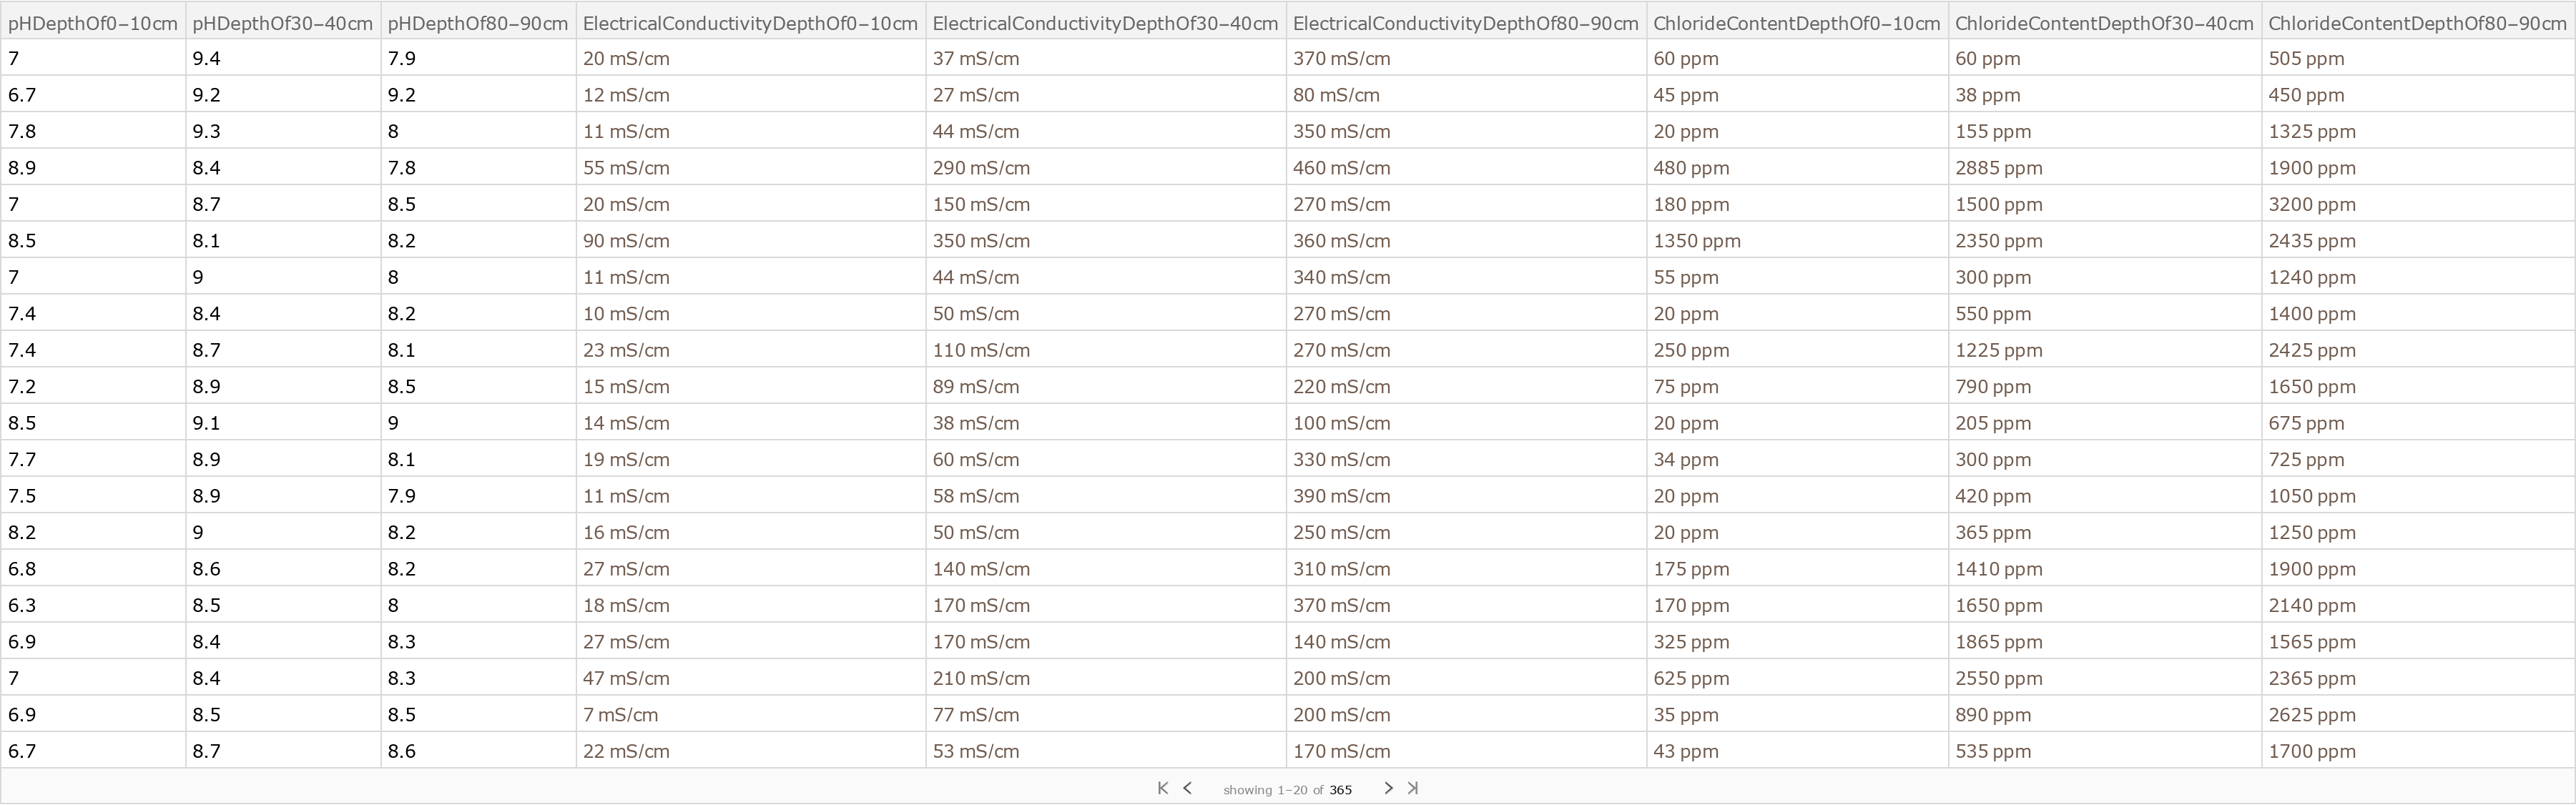 |
Show the pH distributions at each level:
| In[3]:= | ![Histogram[
Transpose[
ResourceData["Sample Data: Gilgai Soil"][
All, {"pHDepthOf0-10cm", "pHDepthOf30-40cm", "pHDepthOf80-90cm"}]], ChartLegends -> Automatic]](https://www.wolframcloud.com/obj/resourcesystem/images/b83/b83616da-a20c-4de1-bce1-16a39cef17f6/401aa37961f64e61.png) |
| Out[3]= | 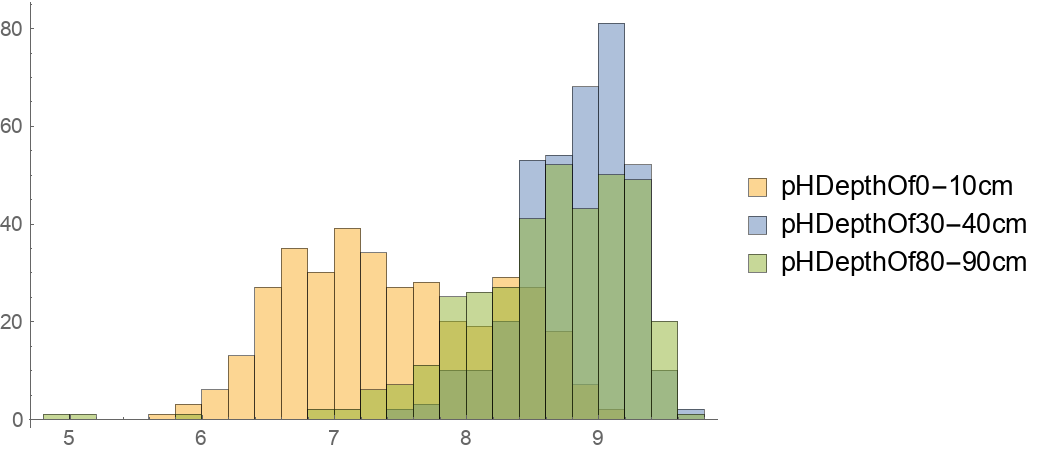 |
Find the means:
| In[4]:= |
| Out[4]= | 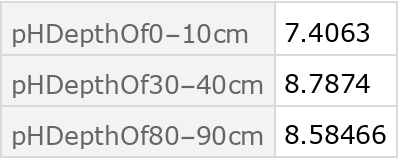 |
Wolfram Research, "Sample Data: Gilgai Soil" from the Wolfram Data Repository (2016) https://doi.org/10.24097/wolfram.57507.data