Basic Examples
Load the data:
The data consists of a set of Vina scores for the molecules from the SWEETLEAD dataset. The lower the score, the better the molecule is able to dock with either the isolated S-protein or the protein-receptor interface. To view the data in connection to the underlying molecules,
Begin by loading the SWEETLEAD dataset as an EntityStore:
Now add the Vina docking scores as properties for each entity:
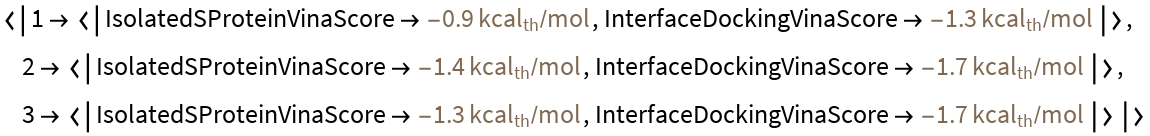
Verify that the docking scores have been added as EntityProperty objects:
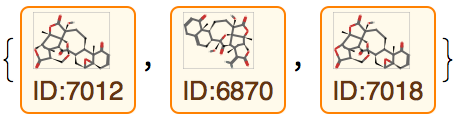
Now find the three entities with the lowest (best) Vina score for the isolated S-protein:
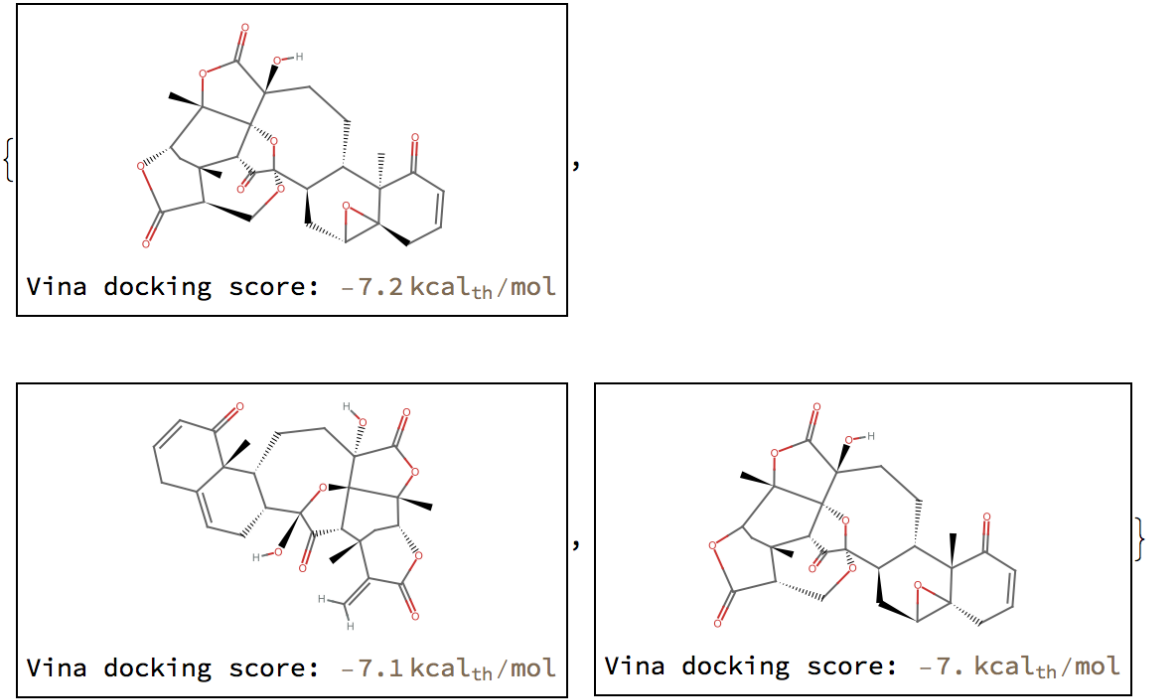
Create labeled structure diagrams from these molecules:
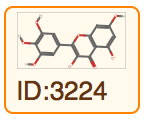
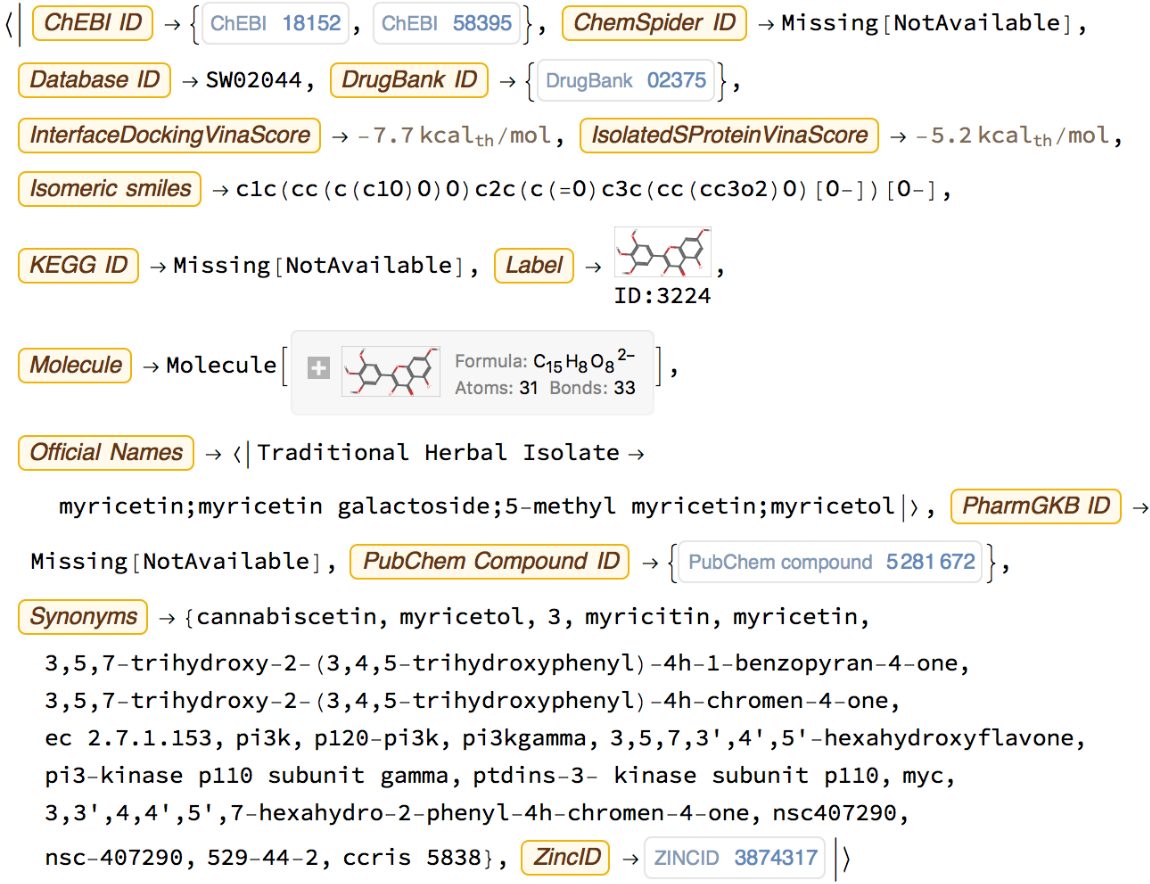
Find the compound with the best docking score for the protein-receptor interface:
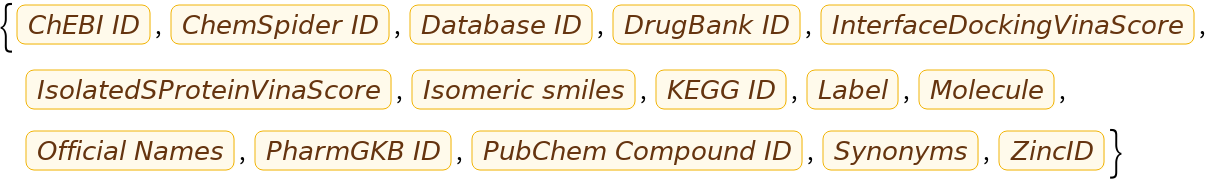
Retrieve all properties from this Entity:
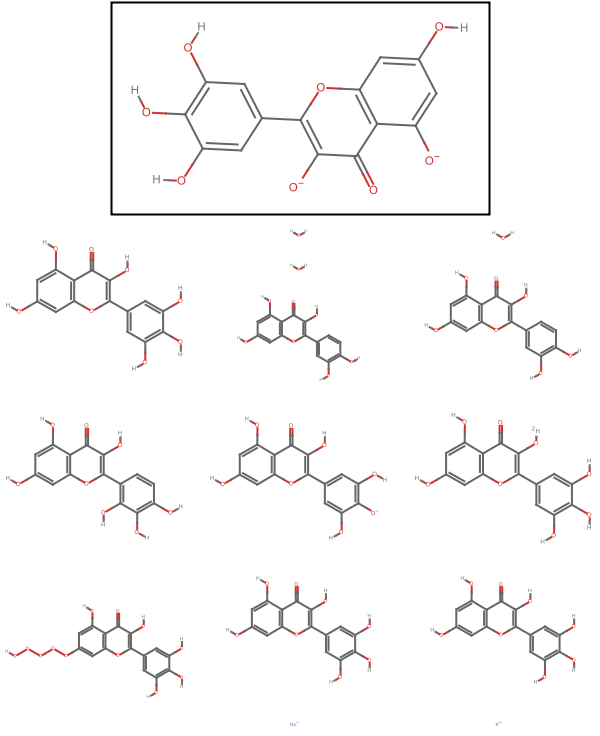
Search PubChem for similar molecules, using a Tanimoto similarity score of 99% or greater as a threshold:
Visualize the entity along with the similar compounds:
Analysis
Create a PredictorFunction to predict the Vina score based on topological descriptors. First get a list of entities with scores for docking to the isolated S-protein:
Using a list of properties that return numeric values for features, prepare a set of labeled data to work with:
Split the labeled data into training and test sets:
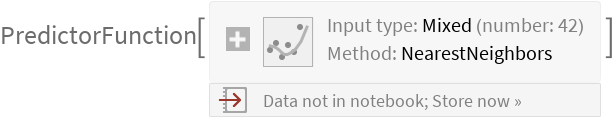
Create the predictor function:
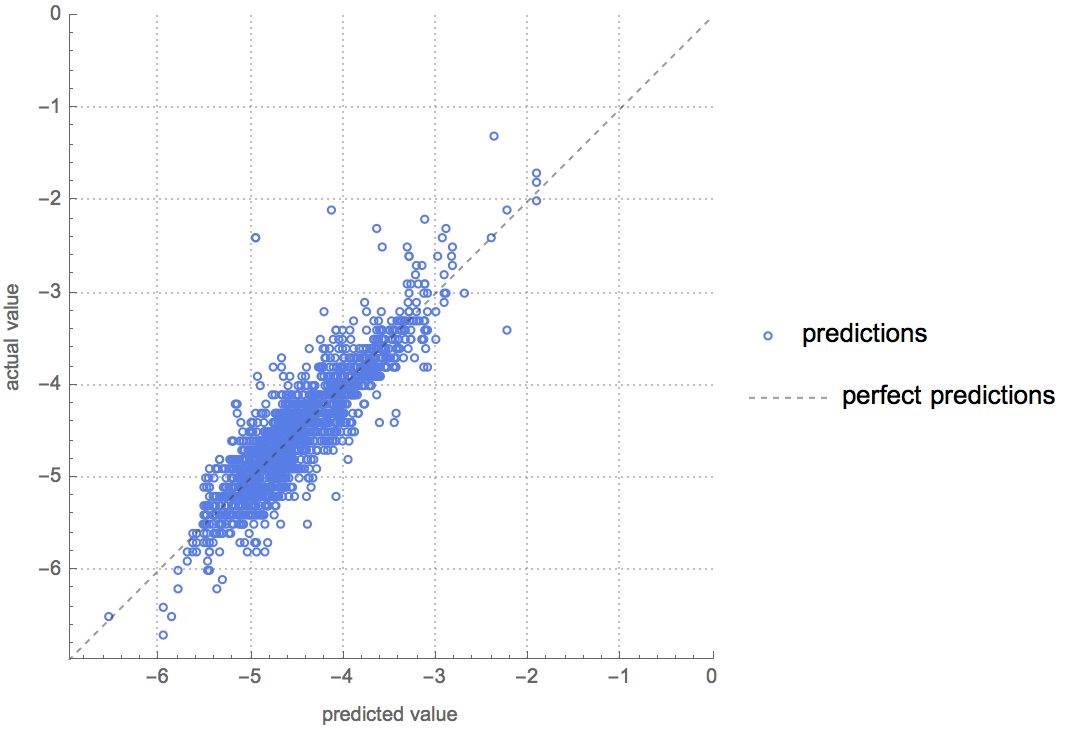
Visualize the results using PredictorMeasurements:
![addPropertiesToEntity[entity_, properties_Association] := KeyValueMap[(Entity["SWEETLEAD", entity][#1] = #2) &, properties]
KeyValueMap[addPropertiesToEntity, ResourceData[\!\(\*
TagBox[
RowBox[{"ResourceObject", "[", "\"\<Repurposing Therapeutics for COVID-19\>\"", "]"}],
#& ,
BoxID -> "ResourceTag-Repurposing Therapeutics for COVID-19-Input",
AutoDelete->True]\)]];](https://www.wolframcloud.com/obj/resourcesystem/images/c2e/c2eb033f-8c70-4ea7-bfc3-19d1d3930894/71ea0851276104f4.png)
![Framed@Labeled[MoleculePlot[#["Molecule"]], Style[Row[{"Vina docking score: ", #@
EntityProperty["SWEETLEAD", "IsolatedSProteinVinaScore"]}]]] & /@ %](https://www.wolframcloud.com/obj/resourcesystem/images/c2e/c2eb033f-8c70-4ea7-bfc3-19d1d3930894/59f1991c7ba1c68f.png)
![bestInterfaceEntity = First@TakeSmallestBy[EntityList["SWEETLEAD"], EntityProperty["SWEETLEAD", "InterfaceDockingVinaScore"], 1]](https://www.wolframcloud.com/obj/resourcesystem/images/c2e/c2eb033f-8c70-4ea7-bfc3-19d1d3930894/11ebd97e92639310.png)
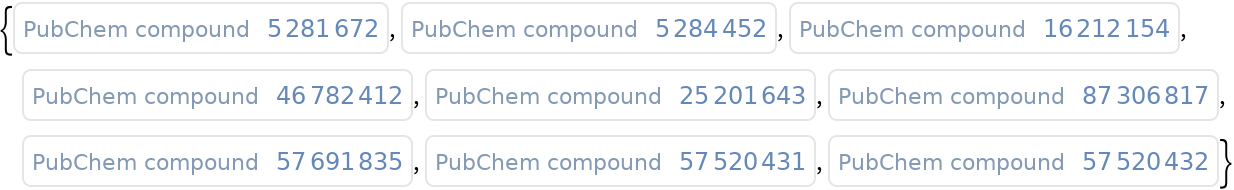
![Column[{Framed[MoleculePlot[entity["Molecule"]]], GraphicsGrid[Partition[MoleculePlot@*Molecule /@ similar, 3], ImageSize -> 300]}, Alignment -> Center
]](https://www.wolframcloud.com/obj/resourcesystem/images/c2e/c2eb033f-8c70-4ea7-bfc3-19d1d3930894/7a7566ef88d57e28.png)
![entities = Select[EntityList[
"SWEETLEAD"], ! MissingQ[#[
EntityProperty["SWEETLEAD", "IsolatedSProteinVinaScore"]]] &];
Length@entities](https://www.wolframcloud.com/obj/resourcesystem/images/c2e/c2eb033f-8c70-4ea7-bfc3-19d1d3930894/2a9876a300f07d92.png)
![molFeatures[e_] := MoleculeValue[e["Molecule"], {
"AliphaticCarbocycleCount", "AliphaticHeterocycleCount", "AliphaticRingCount", "AmideBondCount", "AromaticCarbocycleCount", "AromaticHeterocycleCount", "AromaticRingCount", "BridgeheadAtomCount", "Chi0n", "Chi0v", "Chi1n", "Chi1v", "Chi2n",
"Chi2v", "Chi3n", "Chi3v", "Chi4n", "Chi4v", "CrippenClogP", "CrippenMR", "DegreeOfUnsaturation", "FractionCarbonSP3", "HBondAcceptorCount", "HBondDonorCount", "HeteroatomCount", "HeterocycleCount", "Kappa1", "Kappa2", "Kappa3", "KierHallAlphaShape", "LabuteApproximateSurfaceArea", "LipinskiHBondAcceptorCount", "LipinskiHBondDonorCount", "RingCount", "RotatableBondCount", "SaturatedCarbocycleCount", "SaturatedHeterocycleCount", "SaturatedRingCount", "SpiroAtomCount", "StereocenterCount", "SyntheticAccessibilityScore", "UnspecifiedStereocenterCount"}]
labeledData = Thread[ResourceFunction["DynamicMap"][molFeatures, entities] -> QuantityMagnitude[
EntityValue[entities, EntityProperty["SWEETLEAD", "IsolatedSProteinVinaScore"]]]];](https://www.wolframcloud.com/obj/resourcesystem/images/c2e/c2eb033f-8c70-4ea7-bfc3-19d1d3930894/406204b9a9f22241.png)
![SeedRandom[14];
With[{ld = RandomSample[labeledData]},
training = ld[[;; 7000]];
testset = ld[[7001 ;;]];
]](https://www.wolframcloud.com/obj/resourcesystem/images/c2e/c2eb033f-8c70-4ea7-bfc3-19d1d3930894/1b2eed7ef15695f7.png)