Wolfram Data Repository
Immediate Computable Access to Curated Contributed Data
Locations of the residence of asthmatic (cases) and non-asthmatic (controls) children, annotated with marks including number of household smokers, subject type (case or control), hay fever occurrence, age, distance to the nearest road, distance to pollution sources 1, 2, and 3
Retrieve the data:
| In[1]:= |
| Out[1]= |  |
Summary of the spatial point data:
| In[2]:= |
| Out[2]= | 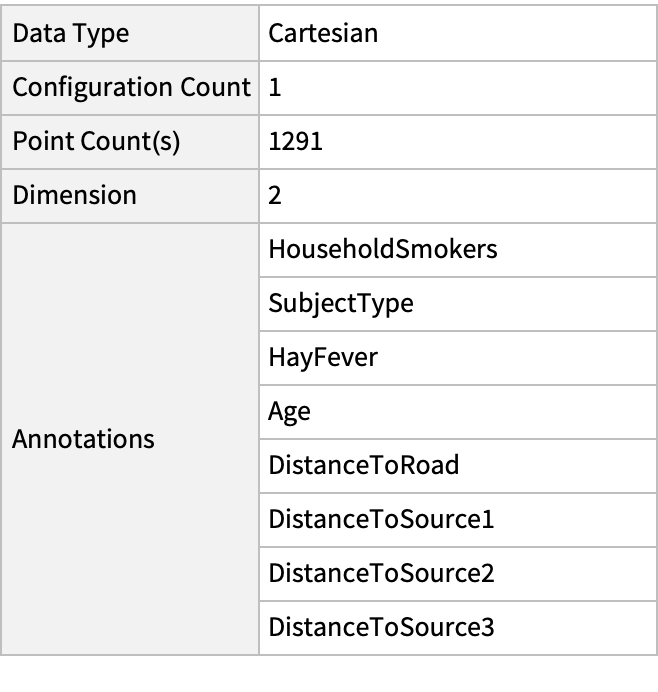 |
List annotations keys:
| In[3]:= |
| Out[3]= |
Plot the spatial point data:
| In[4]:= | ![Show[Graphics[{Opacity[.1], ResourceData[\!\(\*
TagBox["\"\<Sample Data: North Derbyshire Asthma\>\"",
#& ,
BoxID -> "ResourceTag-Sample Data: North Derbyshire Asthma-Input",
AutoDelete->True]\), "ObservationRegion"]}], ListPlot[ResourceData[\!\(\*
TagBox["\"\<Sample Data: North Derbyshire Asthma\>\"",
#& ,
BoxID -> "ResourceTag-Sample Data: North Derbyshire Asthma-Input",
AutoDelete->True]\), "Data"], AspectRatio -> Full], Axes -> True]](https://www.wolframcloud.com/obj/resourcesystem/images/c39/c3994c7d-dfc2-4f84-9f2d-f684fb91bbd1/686d4a922b49166b.png) |
| Out[4]= | 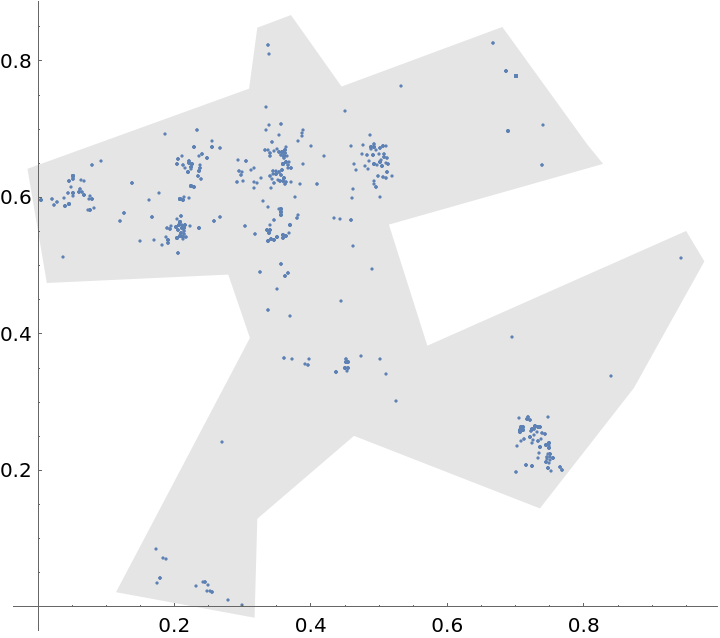 |
Plot the smooth point density:
| In[5]:= |
| Out[5]= |  |
| In[6]:= | ![Show[ContourPlot[density[{x, y}], {x, y} \[Element] ResourceData[\!\(\*
TagBox["\"\<Sample Data: North Derbyshire Asthma\>\"",
#& ,
BoxID -> "ResourceTag-Sample Data: North Derbyshire Asthma-Input",
AutoDelete->True]\), "ObservationRegion"], ColorFunction -> "Rainbow"], ListPlot[ResourceData[\!\(\*
TagBox["\"\<Sample Data: North Derbyshire Asthma\>\"",
#& ,
BoxID -> "ResourceTag-Sample Data: North Derbyshire Asthma-Input",
AutoDelete->True]\), "Data"], PlotStyle -> Black]]](https://www.wolframcloud.com/obj/resourcesystem/images/c39/c3994c7d-dfc2-4f84-9f2d-f684fb91bbd1/25693e3fb91a8ebf.png) |
| Out[6]= | 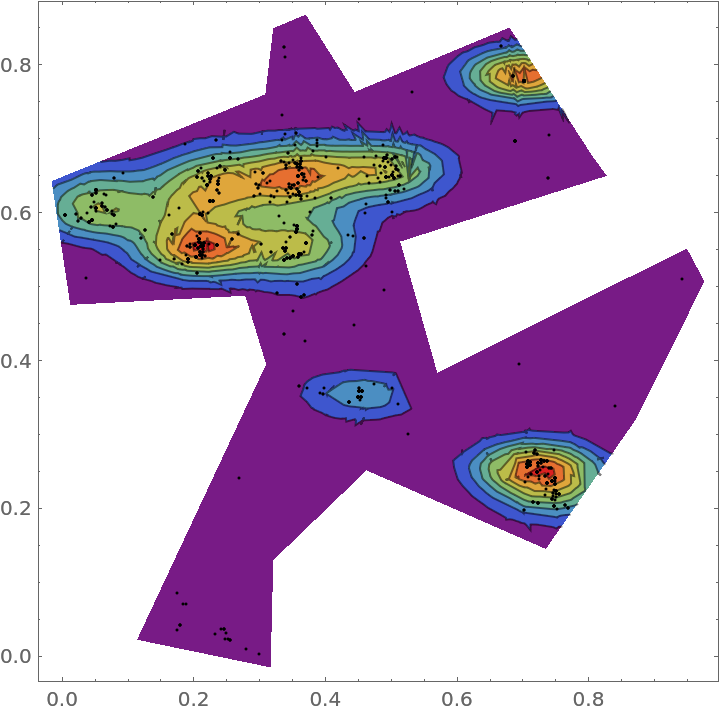 |
Visualize data points annotated with number of household smokers:
| In[7]:= | ![PointValuePlot[spd, {1 -> "DiscreteColor", 2 -> None, 3 -> None, 4 -> None, 5 -> None, 6 -> None, 7 -> None, 8 -> None}, PlotStyle -> PointSize[Medium], PlotLegends -> Automatic, PlotLabel -> "Number of Household Smokers"]](https://www.wolframcloud.com/obj/resourcesystem/images/c39/c3994c7d-dfc2-4f84-9f2d-f684fb91bbd1/1aaf621fd32b2b10.png) |
| Out[7]= | 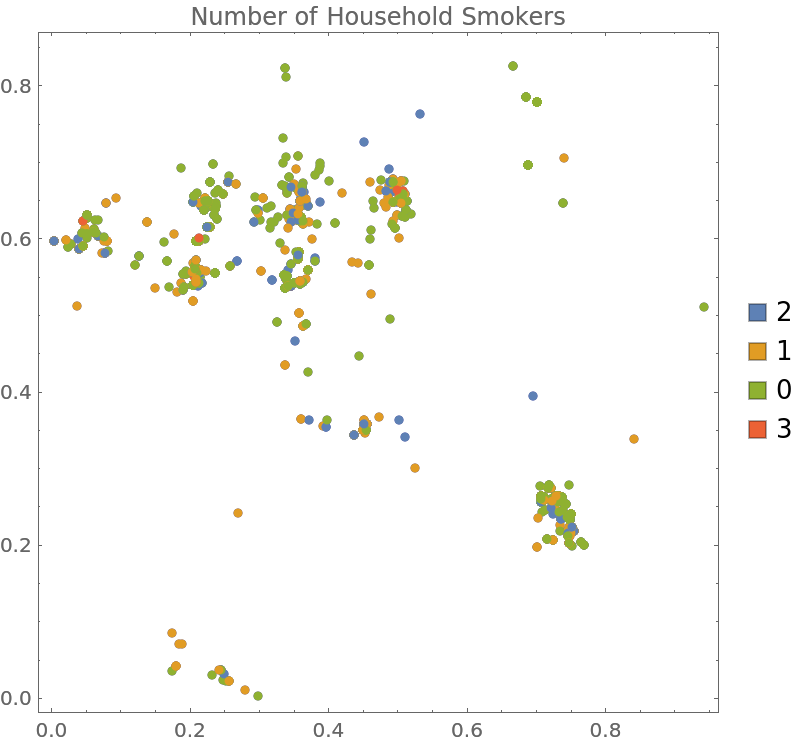 |
Test for complete spacial randomness:
| In[8]:= |
| Out[8]= |
Gosia Konwerska, "Sample Data: North Derbyshire Asthma" from the Wolfram Data Repository (2021)