Wolfram Data Repository
Immediate Computable Access to Curated Contributed Data
Dataset of eustatic sea level and temperatures over the last 40 million years
Originator: De Boer, B., R.S.W. Van de Wal, L.J. Lourens and R. Bintanja
Retrieve the default content:
| In[1]:= |
Plot the sea level change over the last 40 million years:
| In[2]:= | ![ListPlot[
Transpose[
QuantityMagnitude[
Normal[Values[
ResourceData[
"Sea Level and Temperatures Over the Last 40 Million Years"][{"TimeBeforePresent", "SeaLevel"}]]]]], Frame -> True, PlotRange -> All, FrameLabel -> {{None, "Sea Level Change (m)"}, {"Millions of Years Ago", None}}, FrameTicks -> {{Table[{i, i}, {i, -140, 80, 20}], Table[{i, i}, {i, -140, 80, 20}]}, {Table[{i, -i/1000000}, {i, -40000000, 0, 5000000}], Table[{i, -i/1000000}, {i, -40000000, 0, 5000000}]}}]](https://www.wolframcloud.com/obj/resourcesystem/images/cf7/cf73edfe-8868-4c78-9cb5-369905a968bd/5e4a05b8c369bc03.png) |
| Out[2]= | 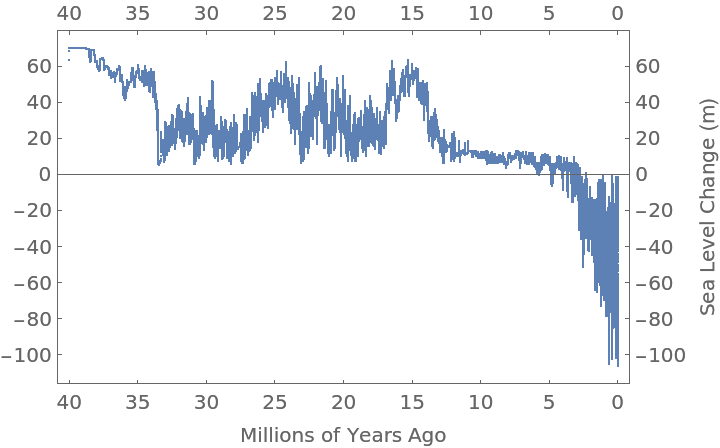 |
Create maps showing how sea level changes affect geographic regions:
| In[3]:= | ![seaint = Interpolation[
Transpose[
QuantityMagnitude[
Normal[Values[
ResourceData[
"Sea Level and Temperatures Over the Last 40 Million Years"][{"TimeBeforePresent", "SeaLevel"}]]]]], InterpolationOrder -> 1];;](https://www.wolframcloud.com/obj/resourcesystem/images/cf7/cf73edfe-8868-4c78-9cb5-369905a968bd/1de3b752614f1cd5.png) |
| In[4]:= |
| In[5]:= | ![With[{ybp = -22000},
ReliefPlot[Reverse[data], PlotRange -> {Full, Full, {seaint[ybp], All}}, ColorFunction -> "FallColors", ClippingStyle -> RGBColor[0, .2, .5],
PerformanceGoal -> "Quality", PlotLabel -> Row[{-Round[ybp], " years ago"}], Epilog -> {Text[Style["Doggerland", 12, White], {275, 175}]}]]](https://www.wolframcloud.com/obj/resourcesystem/images/cf7/cf73edfe-8868-4c78-9cb5-369905a968bd/6285a45ba0e89d48.png) |
| Out[5]= | 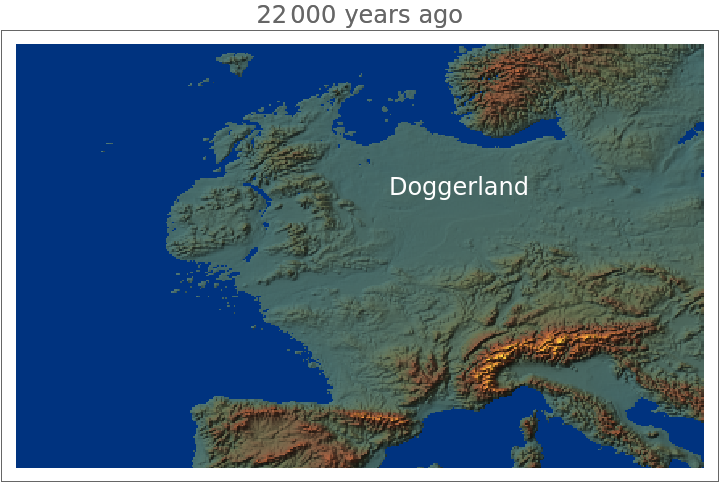 |
Wolfram Research, "Sea Level and Temperatures Over the Last 40 Million Years" from the Wolfram Data Repository (2019) https://doi.org/10.24097/wolfram.90759.data