Get the TimeSeries of Living Planet Index (LPI) data from the raw data published by OurWorldInData repository
Examples
Basic Examples (4)
Find the latest update date:
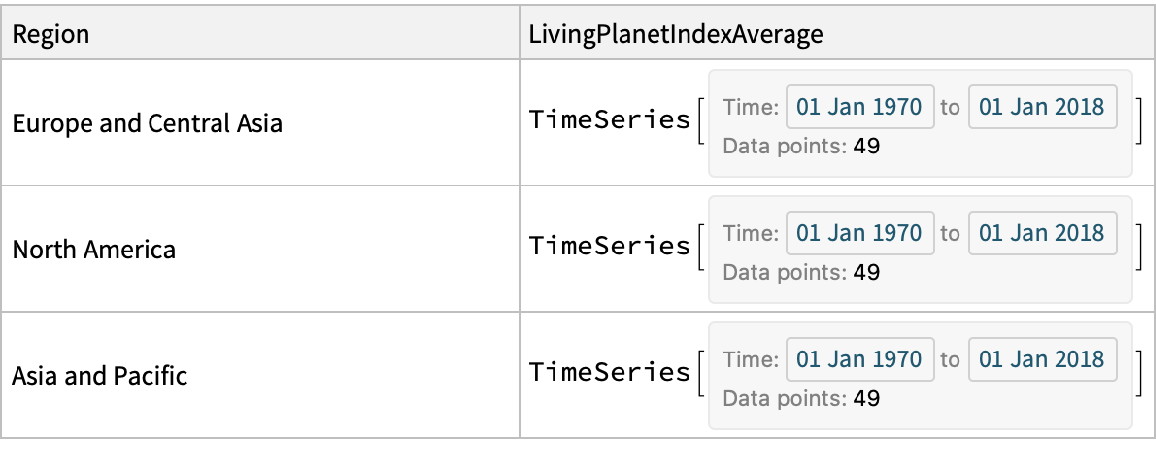
Retrieve the data for the three regions with the highest LivingPlanetIndexAverage in the last update:
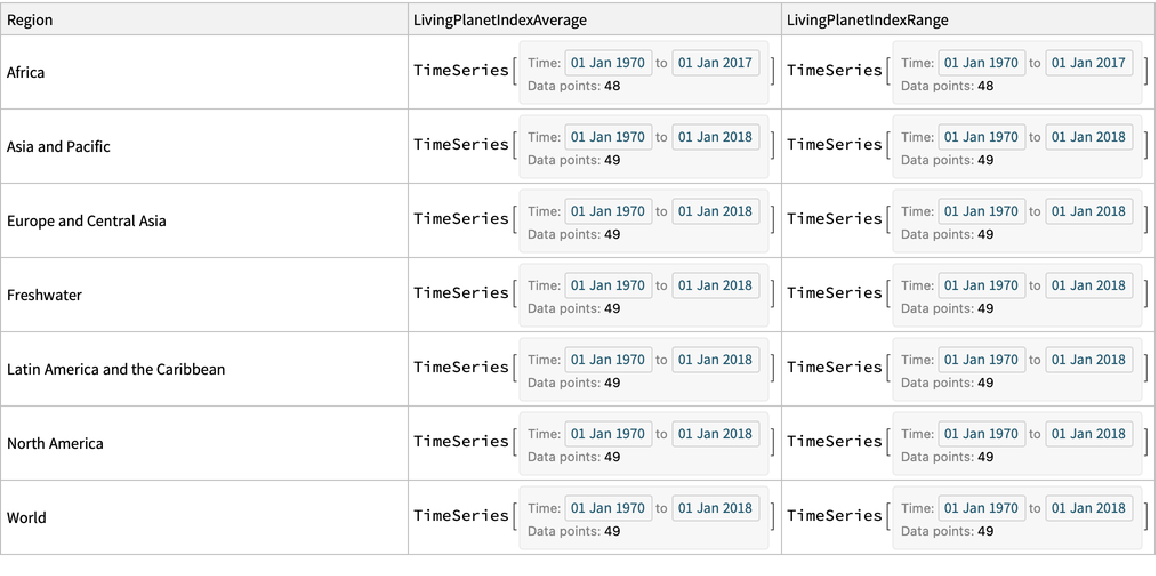
Get the time series for each property for a given region:
Get the most recent values of all properties for a given region:
Get data corresponding to a given date interval for a given region:
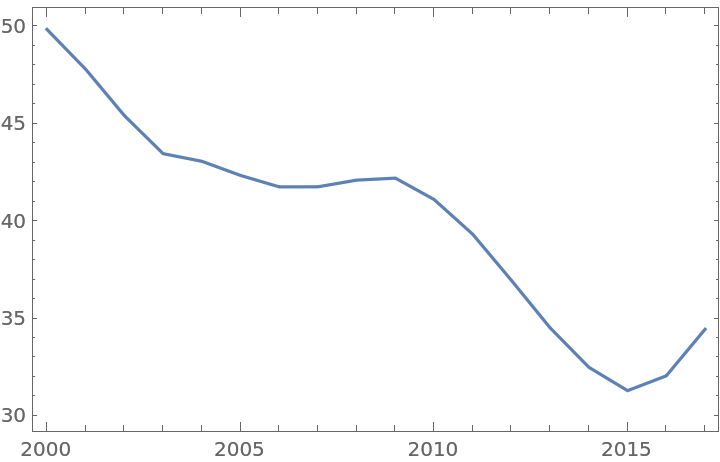
Plot the time series for a given region and property:
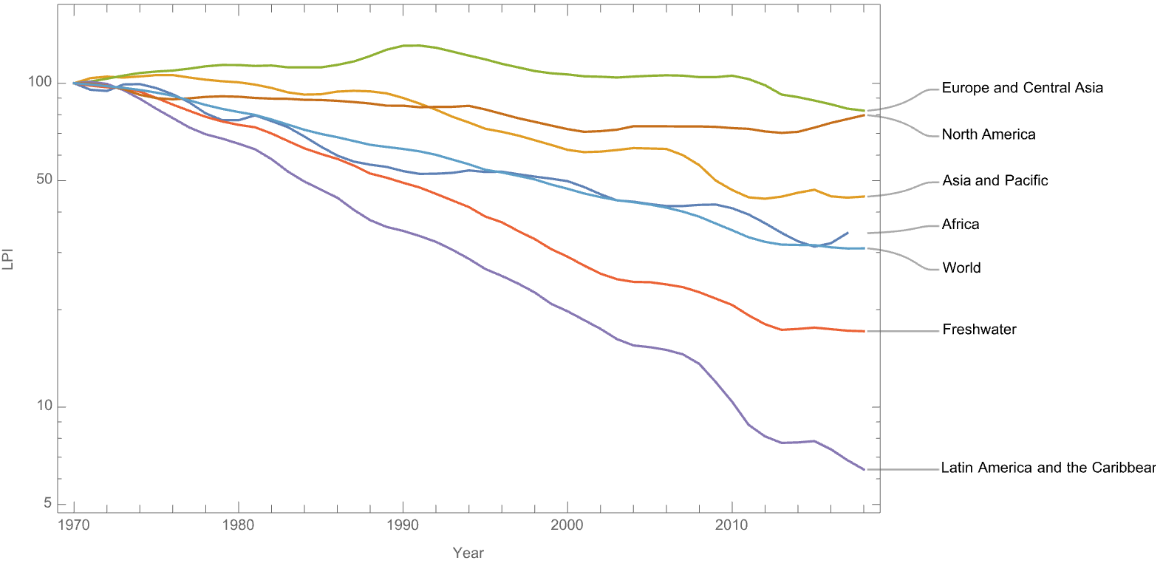
Get and plot the time series for a property of all regions:
Visualizations (1)
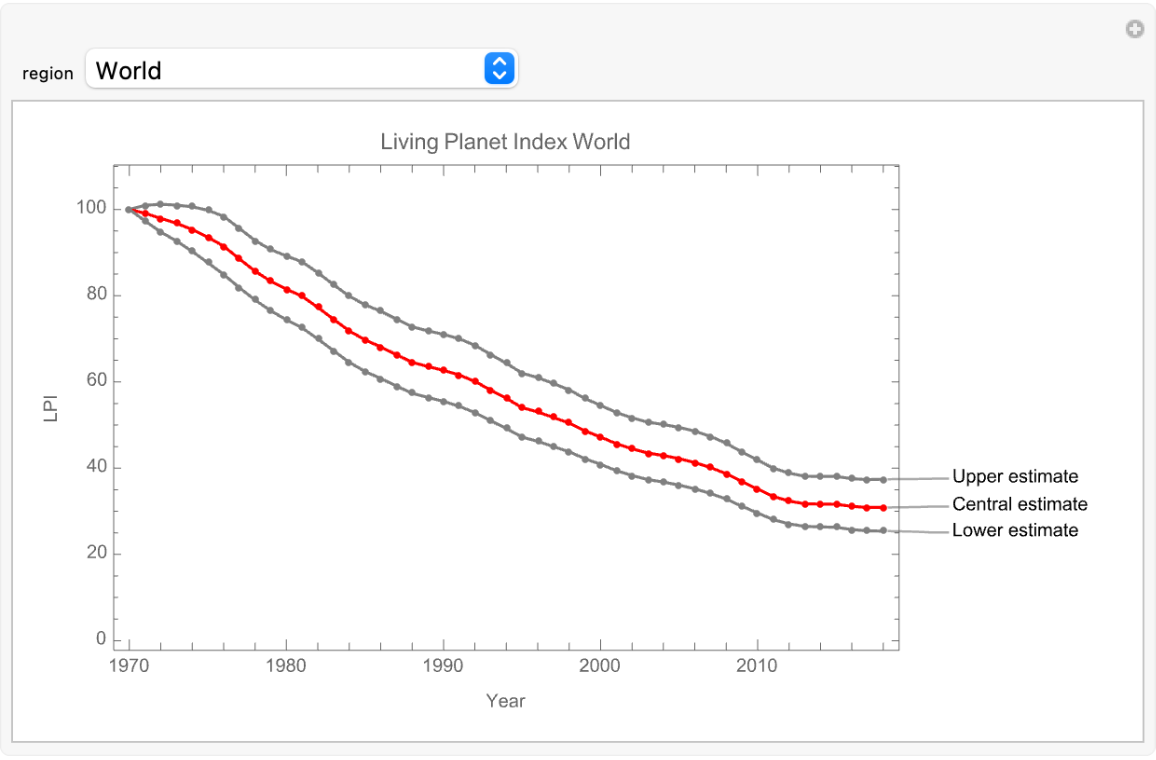
Plot the time series for a given region and all the properties at once:
External Links
Bibliographic Citation
Lina Marcela,
"Living Planet Index Data"
from the Wolfram Data Repository
(2023)
All visualizations, data, and code produced by Our World in Data are completely open access under the Creative Commons BY license. You have the permission to use, distribute, and reproduce these in any medium, provided the source and authors are credited.
Data Resource History
Publisher Information
![ResourceData[\!\(\*
TagBox["\"\<Living Planet Index Data\>\"",
#& ,
BoxID -> "ResourceTag-Living Planet Index Data-Input",
AutoDelete->True]\)][
TakeLargestBy[#LivingPlanetIndexAverage["LastValue"] &, 3], {"Region", "LivingPlanetIndexAverage"}]](https://www.wolframcloud.com/obj/resourcesystem/images/d79/d79f0b6d-c02b-47c8-aa22-8767a076cf2a/371dacd12c179eda.png)


![DateListLogPlot[
Callout[Tooltip[#2, #1], #1] & @@@ Normal@ResourceData[\!\(\*
TagBox["\"\<Living Planet Index Data\>\"",
#& ,
BoxID -> "ResourceTag-Living Planet Index Data-Input",
AutoDelete->True]\)][All, {#Region, #LivingPlanetIndexAverage} &], FrameLabel -> {"Year", "LPI"}]](https://www.wolframcloud.com/obj/resourcesystem/images/d79/d79f0b6d-c02b-47c8-aa22-8767a076cf2a/2bad22246a6ed4fb.png)
![Manipulate[
DateListPlot[{
TimeSeries[Transpose[{#[[3]], #[[2, All, 2]]}]],
TimeSeries[Transpose[{#[[3]], #[[1]]}]],
TimeSeries[Transpose[{#[[3]], #[[2, All, 1]]}]]
} &@
Normal[#][[1]] &@
ResourceData[\!\(\*
TagBox["\"\<Living Planet Index Data\>\"",
#& ,
BoxID -> "ResourceTag-Living Planet Index Data-Input",
AutoDelete->True]\)]
[Select[#Region == region &],
{#LivingPlanetIndexAverage["Values"],
Flatten[#LivingPlanetIndexRange["Values"] /. Interval -> List, 1],
#LivingPlanetIndexRange["Dates"]} &],
IntervalMarkers -> "Bands",
Mesh -> Full,
PlotStyle -> {Gray, Red, Gray},
PlotLabels -> {"Upper estimate", "Central estimate", "Lower estimate"},
FrameLabel -> {"Year", "LPI"},
PlotLabel -> "Living Planet Index " <> region,
ImageSize -> Large],
{{region, "World"}, Normal@ResourceData[\!\(\*
TagBox["\"\<Living Planet Index Data\>\"",
#& ,
BoxID -> "ResourceTag-Living Planet Index Data-Input",
AutoDelete->True]\)][All, "Region"]}]](https://www.wolframcloud.com/obj/resourcesystem/images/d79/d79f0b6d-c02b-47c8-aa22-8767a076cf2a/19cb88dfaa4d3f3a.png)
