Wolfram Data Repository
Immediate Computable Access to Curated Contributed Data
Dataset of the Path of the Total Solar Eclipse of August 21st, 2017
Originator: NASA
The following table delineates the path of the Moon's umbral shadow during the Total Solar Eclipse of 2017 Aug 21. The geographic coordinates (WGS 84) of the northern and southern limits and the central line are listed at 120-second intervals. This provides adequate detail for making plots of the path on larger scale maps. Local circumstances on the central line include the ratio of the apparent diameters of the Moon to the Sun, the Sun's altitude and azimuth (degrees), the path width (kilometers) and the duration on the central line (minutes and seconds).
(9 columns, 99 rows)
Retrieve the dataset:
| In[1]:= |
| Out[1]= | 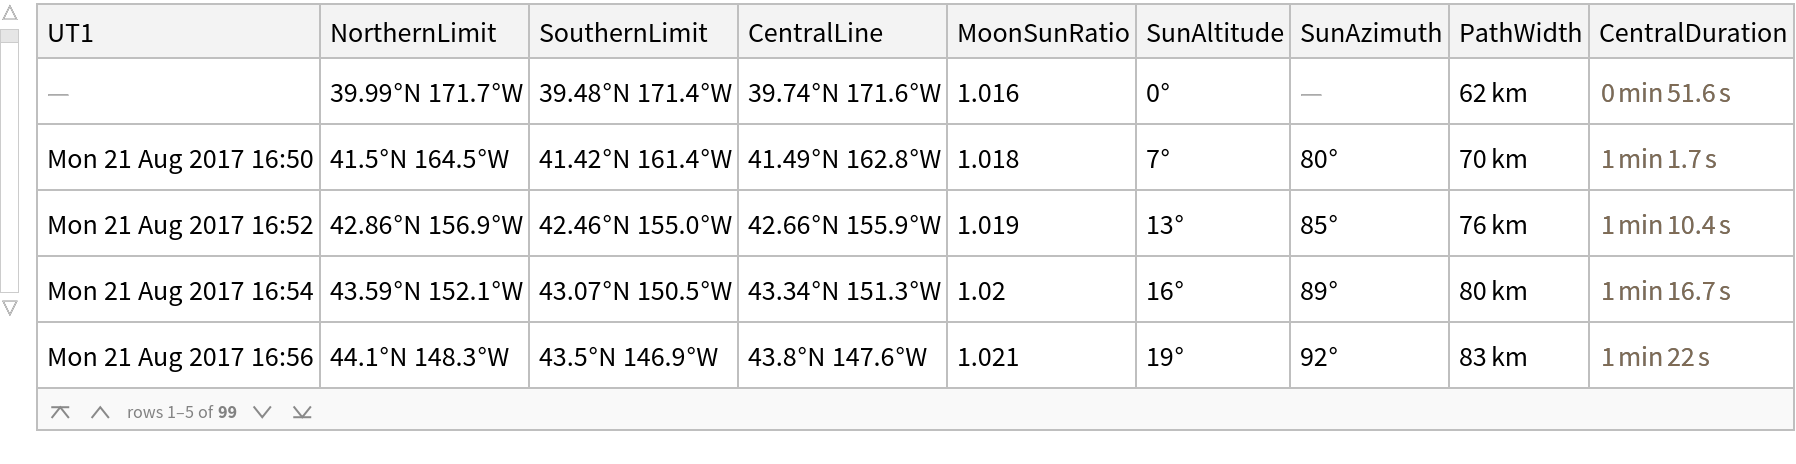 |
Plot the path of the total solar eclipse as it passes through Wyoming, highlighting Jackson, Wyoming and with vertical lines at 2 minute increments:
| In[2]:= | ![With[{quads = Select[ResourceData[
"Path of the Total Solar Eclipse of August 21st, 2017"][[
All, {"UT1", "NorthernLimit", "SouthernLimit", "CentralLine"}]], FreeQ[#, _Missing] &]}, GeoGraphics[{SolarEclipse[DateObject[{2017, 1, 1, 0, 0}], "GraphicsData", EclipseType -> "Total"], Red, PointSize[.01], Point[Entity["City", {"Jackson", "Wyoming", "UnitedStates"}]], Table[Tooltip[Line[{quads[[i, 2]], quads[[i, 4]], quads[[i, 3]]}], quads[[i, 1]]], {i, 1, Length[quads], 1}]}, GeoCenter -> Entity["AdministrativeDivision", {"Wyoming", "UnitedStates"}], GeoRange -> Entity["AdministrativeDivision", {"Wyoming", "UnitedStates"}], ImageSize -> 800]]](https://www.wolframcloud.com/obj/resourcesystem/images/da9/da9d40b7-c5f9-4cf4-9743-11a854718ef4/3722b6d5a44d73c9.png) |
| Out[2]= | 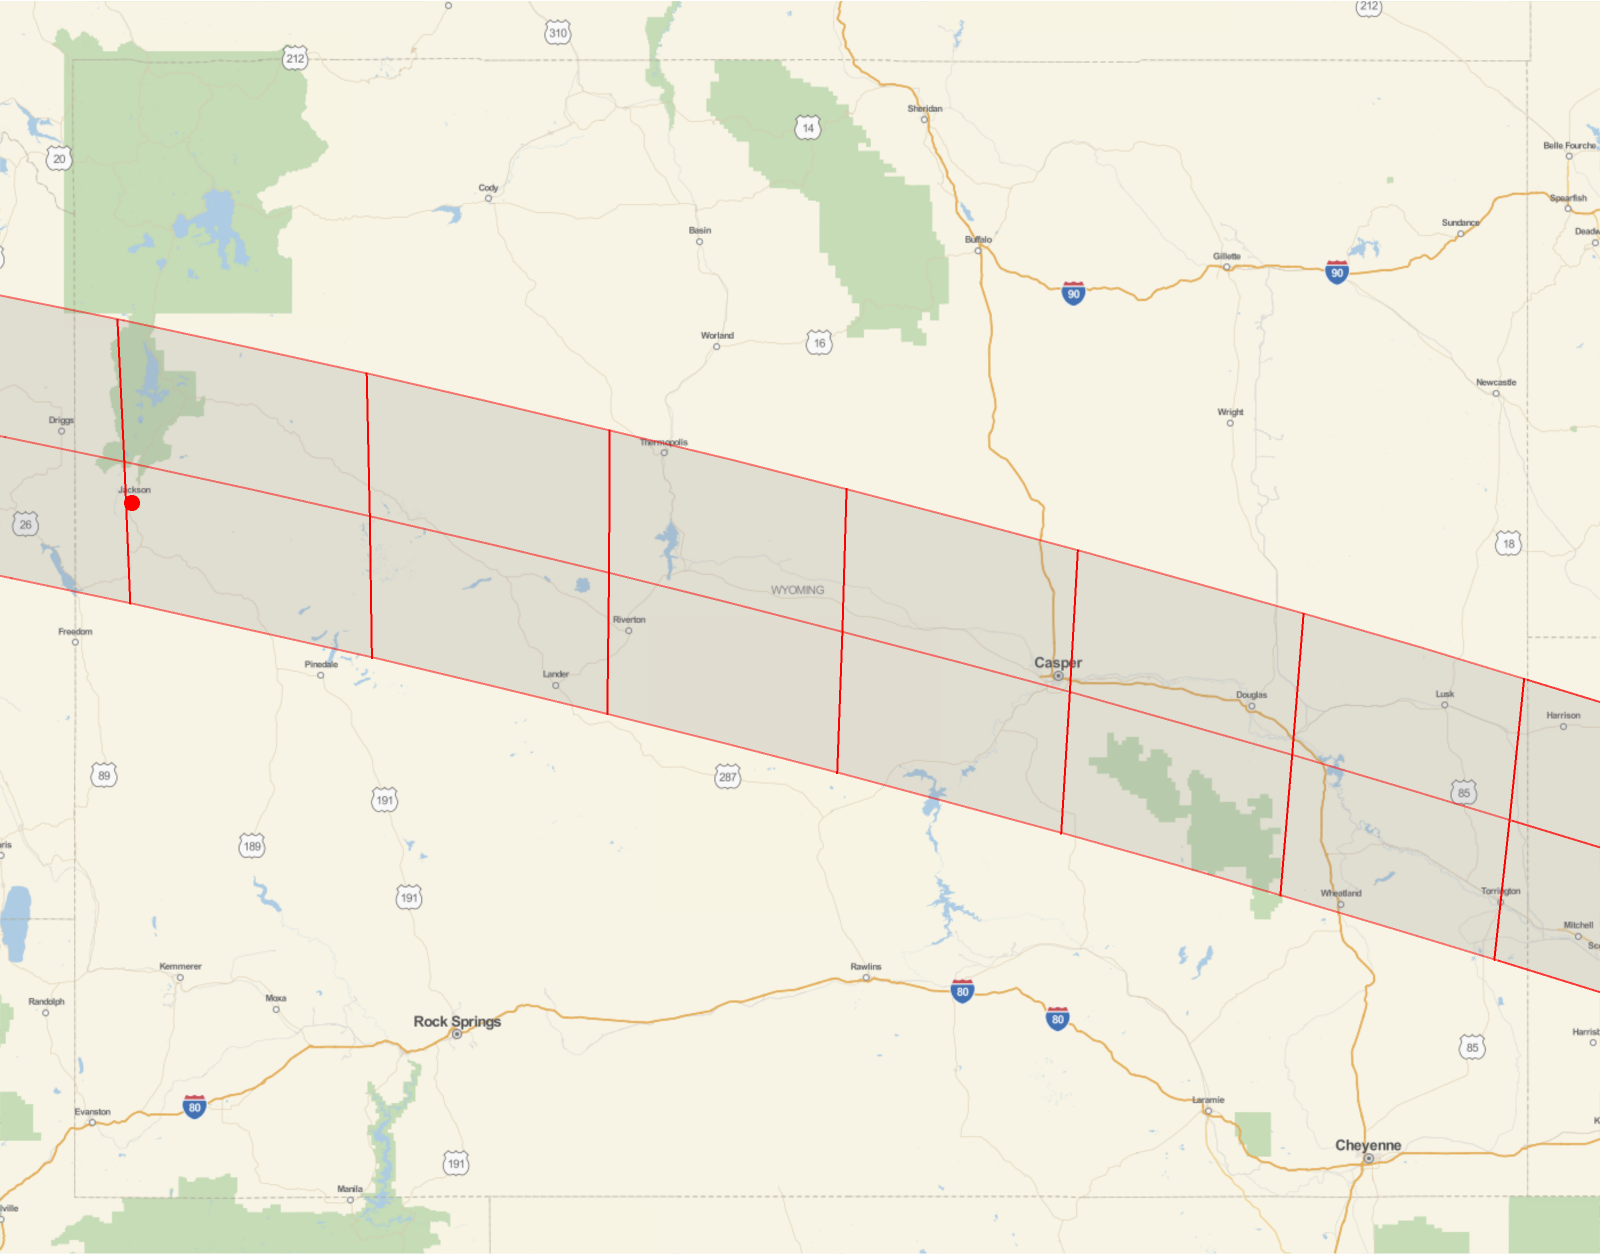 |
Wolfram Research, "Path of the Total Solar Eclipse of August 21st, 2017" from the Wolfram Data Repository (2017) https://doi.org/10.24097/wolfram.71208.data