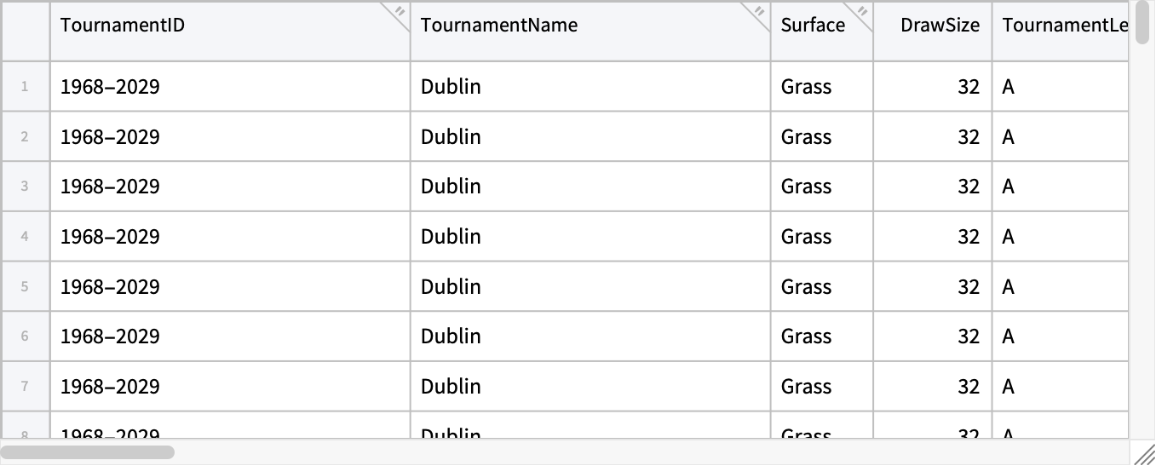
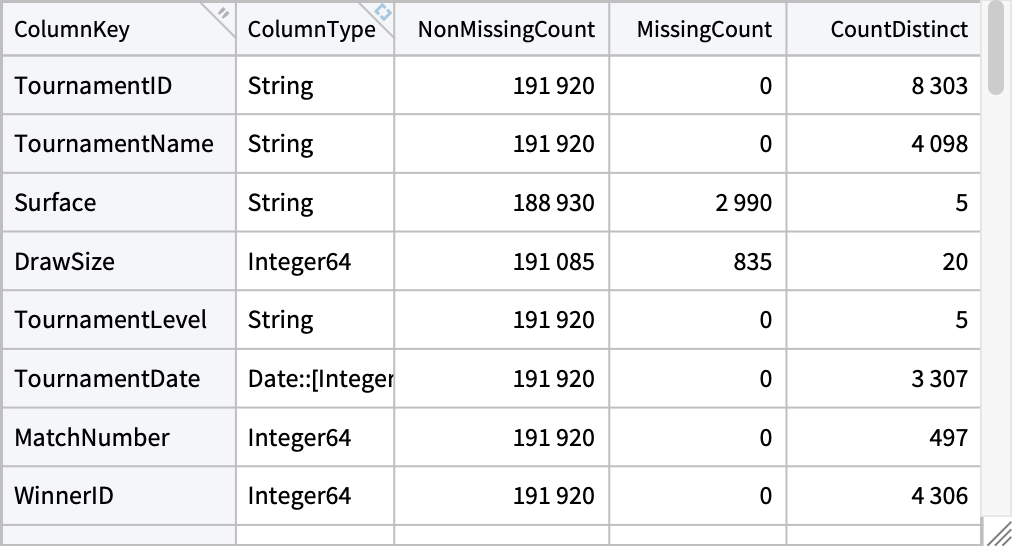
| "TournamentID" | Unique tournament ID |
| "TournamentName" | Tournament name |
| "Surface" | Type of surface match is played on (i.e., grass, clay, hard or carpet) |
| "DrawSize" | Number of players in tournament draw |
| "TournamentLevel" | Tournament Level |
| "TournamentDate" | Tournament Date |
| "MatchNumber" | Unique identifier for match within tournament |
| "WinnerID" | Unique identifier for player who won the match |
| "WinnerSeed" | Seed number of match winner, if applicable |
| "WinnerName" | Name of player who won match |
| "WinnerHand" | Playing hand of winner (left or right) |
| "WinnerHeight" | Height of winner in centimeters |
| "WinnerIOC" | International Olympic Committee country code for winner |
| "WinnerAge" | Age of winner at time of match. |
| "LoserID" | Unique identifier for player who lost the match |
| "LoserSeed" | Seed number of match loser, if applicable |
| "LoserName" | Name of player who lost match |
| "LoserHand" | Playing hand of loser (left or right) |
| "LoserHeight" | Height of loser in centimeters |
| "LoserIOC" | International Olympic Committee country code for loser |
| "LoserAge" | Age of loser at time of match |
| "Score" | Final score of match |
| "BestOf" | Maximum number of sets to be played (i.e., best of 3 or 5) |
| "Round" | Round of tournament in which match was played |
| "Minutes" | Total duration of match in minutes |
| "WAces" | Number of aces served by winner |
| "WDoubleFaults" | Number of double faults made by winner |
| "WServePoints" | Total number of serve points played by winner |
| "W1stServeIn" | Number of first serves made by winner |
| "W1stServeWon" | Number of points won on first serve by winner |
| "W2ndServeWon" | Number of points won on second serve by winner |
| "WServeGames" | Number of service games played by winner |
| "WBpSaved" | Number of break points saved by winner |
| "WBpFaced" | Number of break points faced by winner |
| "LAces" | Number of aces served by loser |
| "LDoubleFaults" | Number of double faults made by loser |
| "LServePoints" | Total number of serve points played by loser |
| "L1stServeIn" | Number of first serves made by loser |
| "L1stServeWon" | Number of points won on first serve by loser |
| "L2ndServeWon" | Number of points won on second serve by loser |
| "LServeGames" | Number of service games played by loser |
| "LBpSaved" | Number of break points saved by loser |
| "LBpFaced" | Number of break points faced by loser |
| "WinnerRank" | ATP ranking of winner at time of match |
| "WinnerRankPoints" | ATP ranking points of winner at time of match |
| "LoserRank" | ATP ranking of loser at time of match |
| "LoserRankPoints" | ATP ranking points of loser at time of match |
![TabularStructure[ResourceData[\!\(\*
TagBox["\"\<ATP Tennis Singles Matches\>\"",
#& ,
BoxID -> "ResourceTag-ATP Tennis Singles Matches-Input",
AutoDelete->True]\)], All, {"ColumnType", "NonMissingCount", "MissingCount", "CountDistinct"}]](https://www.wolframcloud.com/obj/resourcesystem/images/e18/e183de60-080e-4423-a1b9-88ad9e8f0d07/115386ad2a8b34f1.png)
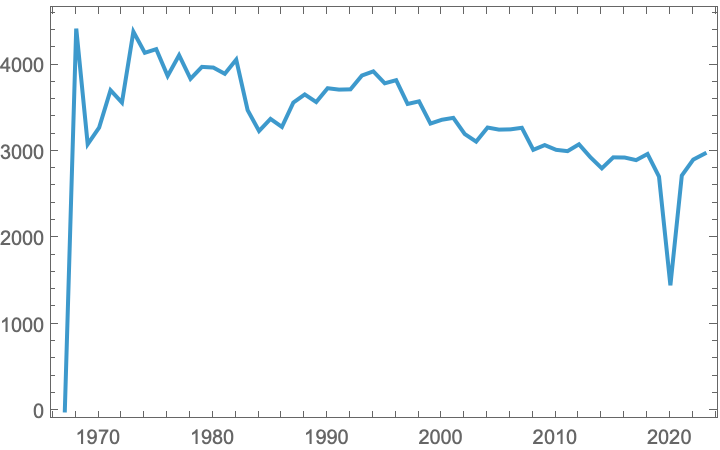
![DateListPlot[GroupBy[ResourceData[\!\(\*
TagBox["\"\<ATP Tennis Singles Matches\>\"",
#& ,
BoxID -> "ResourceTag-ATP Tennis Singles Matches-Input",
AutoDelete->True]\)], DateObject[{#TournamentDate["Year"]}] &, Length]]](https://www.wolframcloud.com/obj/resourcesystem/images/e18/e183de60-080e-4423-a1b9-88ad9e8f0d07/34e71cc399a4bb3b.png)
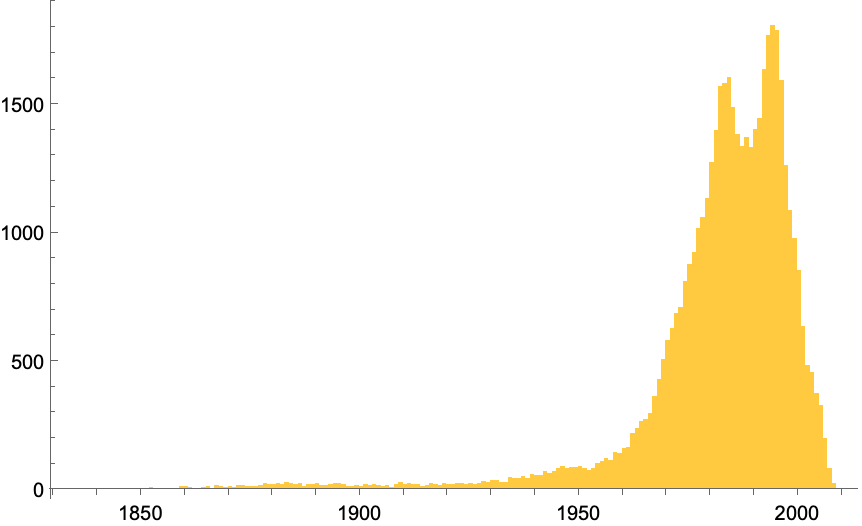
![DateHistogram[Normal[ResourceData[\!\(\*
TagBox["\"\<ATP Tennis Singles Matches\>\"",
#& ,
BoxID -> "ResourceTag-ATP Tennis Singles Matches-Input",
AutoDelete->True]\), "Players"][All, "DOB"]], "Year", "Count"]](https://www.wolframcloud.com/obj/resourcesystem/images/e18/e183de60-080e-4423-a1b9-88ad9e8f0d07/2b6e2661658da334.png)
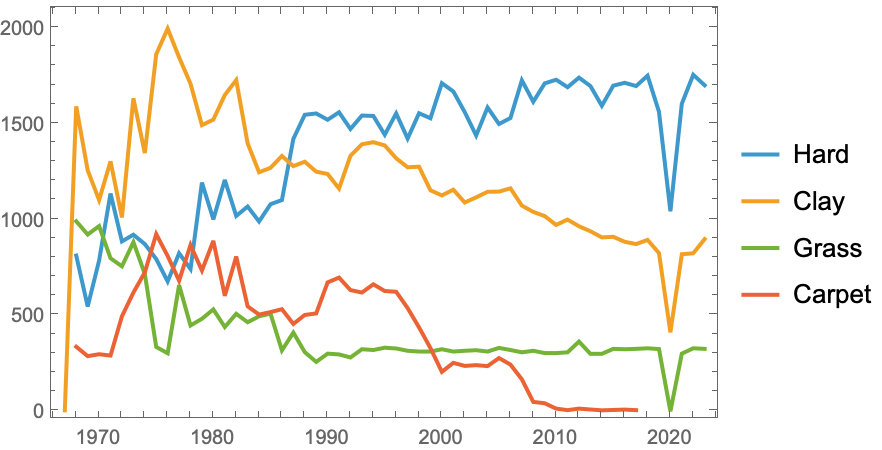
![Module[{surfaces, groupBySurface, surfaceData}, surfaces = {"Hard", "Clay", "Grass", "Carpet"};
groupBySurface = Normal@GroupBy[ResourceData[\!\(\*
TagBox["\"\<ATP Tennis Singles Matches\>\"",
#& ,
BoxID -> "ResourceTag-ATP Tennis Singles Matches-Input",
AutoDelete->True]\)], {#Surface, DateObject[{#TournamentDate["Year"]}]} &, Length]; surfaceData = AssociationMap[
surfaceName |-> {#[[1, 2]], #[[2]]} & /@ Select[groupBySurface, #[[1, 1]] == surfaceName &], surfaces]; DateListPlot[Values[surfaceData], PlotLegends -> surfaces]]](https://www.wolframcloud.com/obj/resourcesystem/images/e18/e183de60-080e-4423-a1b9-88ad9e8f0d07/4c4fdd26375ac7f3.png)
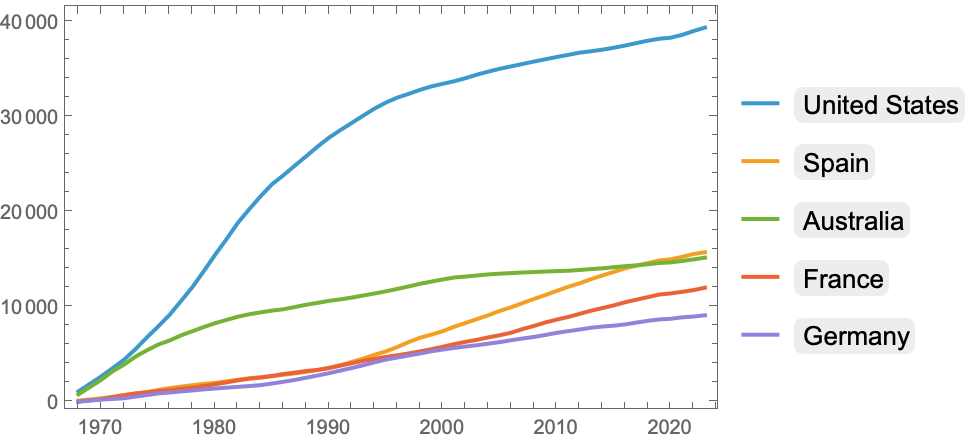
![Module[{data, groupByCoutry, countryCodes, coutryData, largestByWins}, data = ResourceData[\!\(\*
TagBox["\"\<ATP Tennis Singles Matches\>\"",
#& ,
BoxID -> "ResourceTag-ATP Tennis Singles Matches-Input",
AutoDelete->True]\)]; groupByCoutry = GroupBy[data, {DateObject[{#TournamentDate["Year"]}], #WinnerIOC} &,
Length] // Normal;
countryCodes = Union[data[All, "WinnerIOC"] // Normal];
coutryData = AssociationMap[
country |-> AssociationThread[#[[All, 1, 1]] -> Accumulate[Values[#]]] & /@ {Select[
groupByCoutry, #[[1, 2]] == country &]}, countryCodes]; largestByWins = TakeLargestBy[coutryData, Last[Last[Values[#]]] &, 5]; DateListPlot[Values[largestByWins], PlotLegends -> Keys[largestByWins]]]](https://www.wolframcloud.com/obj/resourcesystem/images/e18/e183de60-080e-4423-a1b9-88ad9e8f0d07/19369e40976792de.png)
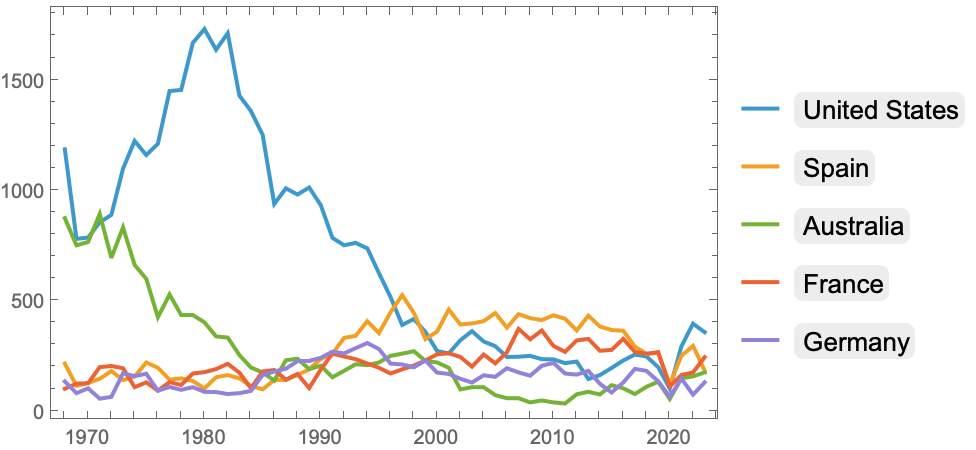
![Module[{data, groupByCoutryYearly, countryCodes, coutryDataYearly, largestByWinsYearly}, data = ResourceData[\!\(\*
TagBox["\"\<ATP Tennis Singles Matches\>\"",
#& ,
BoxID -> "ResourceTag-ATP Tennis Singles Matches-Input",
AutoDelete->True]\)]; groupByCoutryYearly = Normal@GroupBy[
data, {DateObject[{#TournamentDate["Year"]}], #WinnerIOC} &, Length];
countryCodes = Union[data[All, "WinnerIOC"] // Normal];
coutryDataYearly = AssociationMap[
country |-> {#[[1, 1]], #[[2]]} & /@ Select[groupByCoutryYearly, #[[1, 2]] == country &], countryCodes]; largestByWinsYearly = TakeLargestBy[coutryDataYearly, Total[#[[All, 2]]] &, 5]; DateListPlot[Values[largestByWinsYearly], PlotLegends -> Keys[largestByWinsYearly], PlotRange -> All]]](https://www.wolframcloud.com/obj/resourcesystem/images/e18/e183de60-080e-4423-a1b9-88ad9e8f0d07/61eddded5562044e.png)
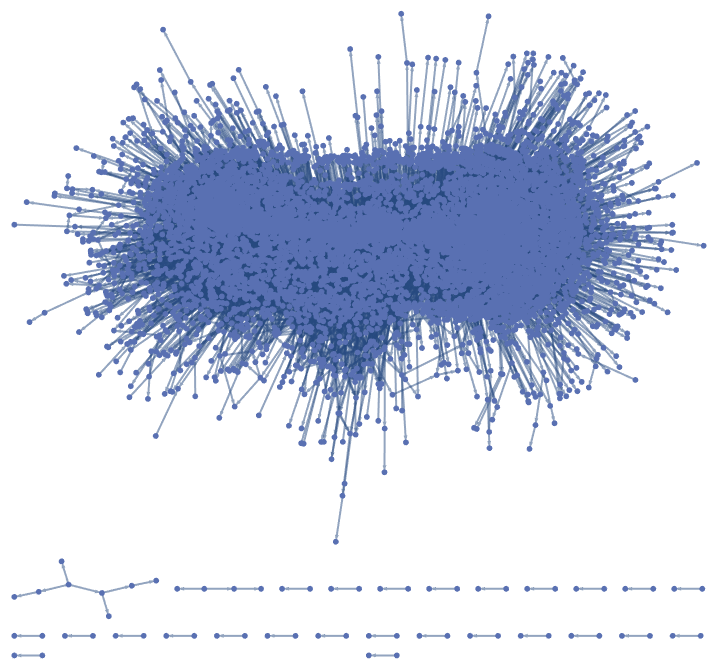
![winnersAndLosers = ResourceData[\!\(\*
TagBox["\"\<ATP Tennis Singles Matches\>\"",
#& ,
BoxID -> "ResourceTag-ATP Tennis Singles Matches-Input",
AutoDelete->True]\)][All, {"WinnerName", "LoserName"}]; edges = DirectedEdge @@@ (Values /@ Normal[winnersAndLosers]);
graph = Graph[edges]](https://www.wolframcloud.com/obj/resourcesystem/images/e18/e183de60-080e-4423-a1b9-88ad9e8f0d07/1cebb7b9eda37e7f.png)