Wolfram Data Repository
Immediate Computable Access to Curated Contributed Data
Fuel economy data for years 1999 and 2008 for 38 popular models of cars
| In[1]:= |
| Out[1]= | 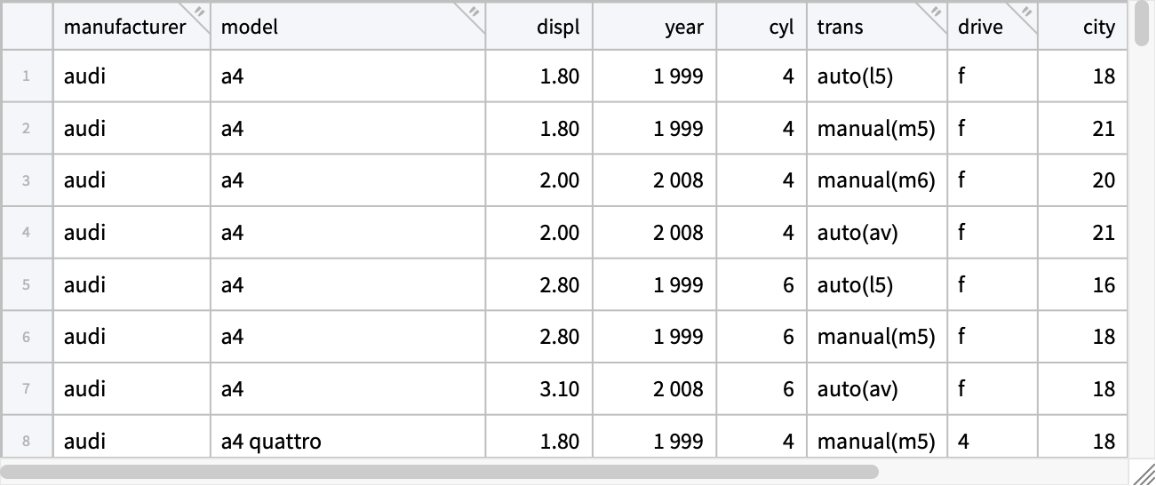 |
Dimensions:
| In[2]:= |
| Out[2]= |
Column keys and descriptions:
| In[3]:= |
| Out[3]= |
| In[4]:= |
| Out[4]= | 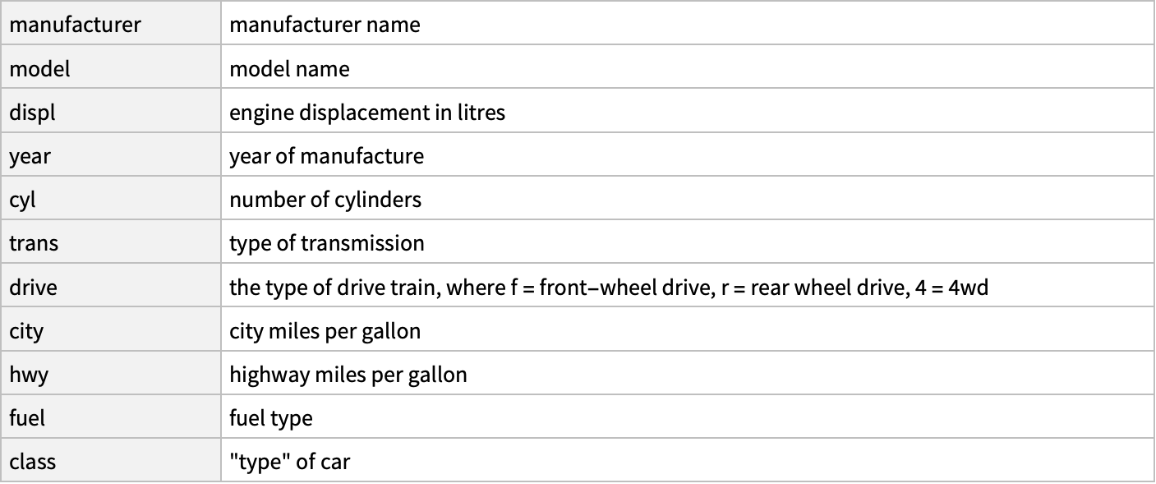 |
Column types:
| In[5]:= |
| Out[5]= |
Tally each model per manufacturer:
| In[6]:= | ![AggregateRows[ResourceData[\!\(\*
TagBox["\"\<Sample Tabular Data: Fuel Economy\>\"",
#& ,
BoxID -> "ResourceTag-Sample Tabular Data: Fuel Economy-Input",
AutoDelete->True]\)], "model_count" -> Function[Length[#model]], {"manufacturer", "model"}]](https://www.wolframcloud.com/obj/resourcesystem/images/e45/e45dcb42-9b1d-4fc2-825a-d53b6fd3865c/43e63775fe7a675b.png) |
| Out[6]= | 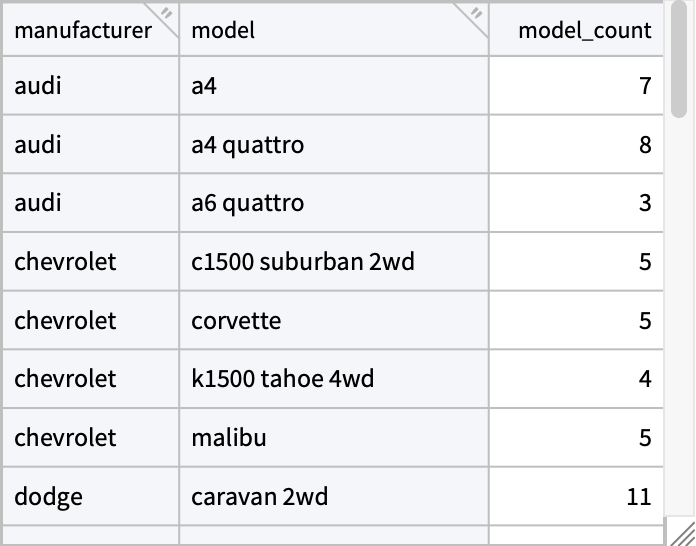 |
Find the mean mileage for each class and year:
| In[7]:= | ![AggregateRows[ResourceData[\!\(\*
TagBox["\"\<Sample Tabular Data: Fuel Economy\>\"",
#& ,
BoxID -> "ResourceTag-Sample Tabular Data: Fuel Economy-Input",
AutoDelete->True]\)], {"hwy_mean" -> Function[Mean[#"hwy"]], "city_mean" -> Function[Mean[#"city"]]}, {"class", "year"}]](https://www.wolframcloud.com/obj/resourcesystem/images/e45/e45dcb42-9b1d-4fc2-825a-d53b6fd3865c/0cfb9efbf6ce5236.png) |
| Out[7]= | 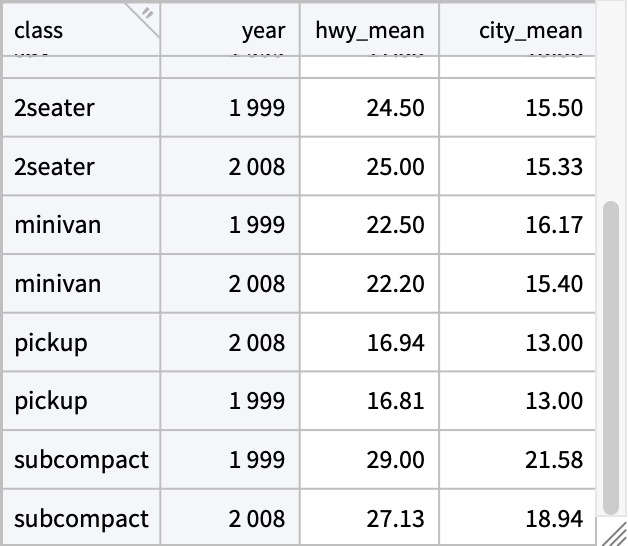 |
Compare displacement between the years:
| In[8]:= | ![pivot = PivotToColumns[ResourceData[\!\(\*
TagBox["\"\<Sample Tabular Data: Fuel Economy\>\"",
#& ,
BoxID -> "ResourceTag-Sample Tabular Data: Fuel Economy-Input",
AutoDelete->True]\)][All, {"year", "displ"}], "year" -> "displ"]](https://www.wolframcloud.com/obj/resourcesystem/images/e45/e45dcb42-9b1d-4fc2-825a-d53b6fd3865c/7b9403dd537dce61.png) |
| Out[8]= | 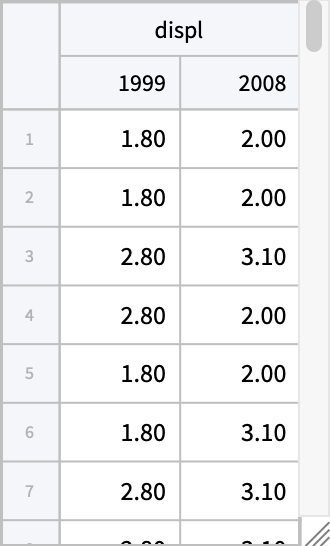 |
The new tabular has extended keys:
| In[9]:= |
| Out[9]= |
Plot histogram for each year:
| In[10]:= |
| Out[10]= | 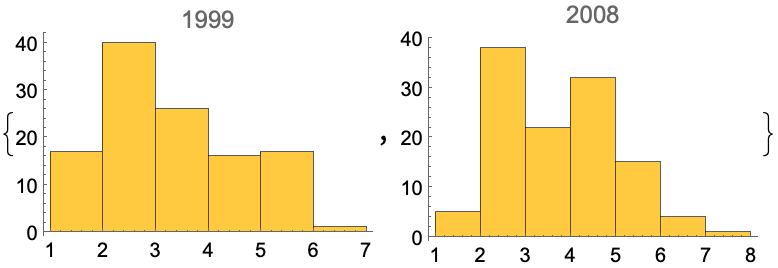 |
Gosia Konwerska, "Sample Tabular Data: Fuel Economy" from the Wolfram Data Repository (2024)