Wolfram Data Repository
Immediate Computable Access to Curated Contributed Data
Time series data for number of beds per US state for 1000 inhabitants by ownership type
Get the first entry from the dataset:
| In[1]:= |
| Out[1]= | 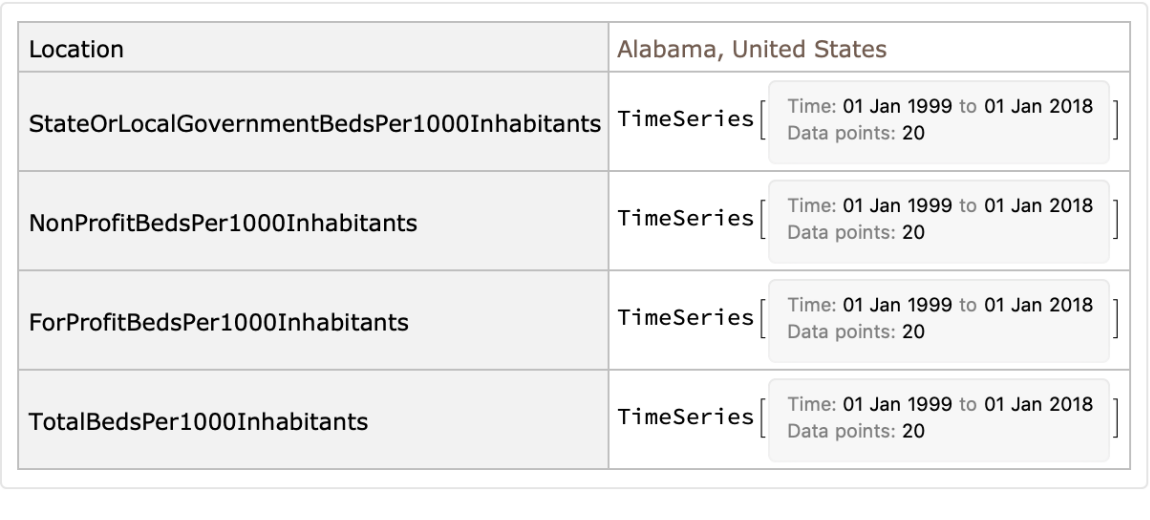 |
Plot the time series of the total number of beds per 1000 inhabitants in Alabama:
| In[2]:= |
| Out[2]= |  |
Compare the last available value of total number of beds per 1000 inhabitants by country:
| In[3]:= | ![BarChart[#, ChartLabels -> CommonName@Keys@#, Sequence[
BarOrigin -> Left, PlotTheme -> "Business", AspectRatio -> 1.5]] &@
Sort@Normal@ResourceData[\!\(\*
TagBox[
RowBox[{"ResourceObject", "[", "\"\<Hospital Beds Per US State\>\"", "]"}],
#& ,
BoxID -> "ResourceTag-Hospital Beds Per US State-Input",
AutoDelete->True]\)][GroupBy["Location"], Total, #TotalBedsPer1000Inhabitants["LastValue"] &]](https://www.wolframcloud.com/obj/resourcesystem/images/e8e/e8e71ade-ac45-4a8a-9e50-84f8b1253ef6/336928d9588fcbd4.png) |
| Out[3]= | 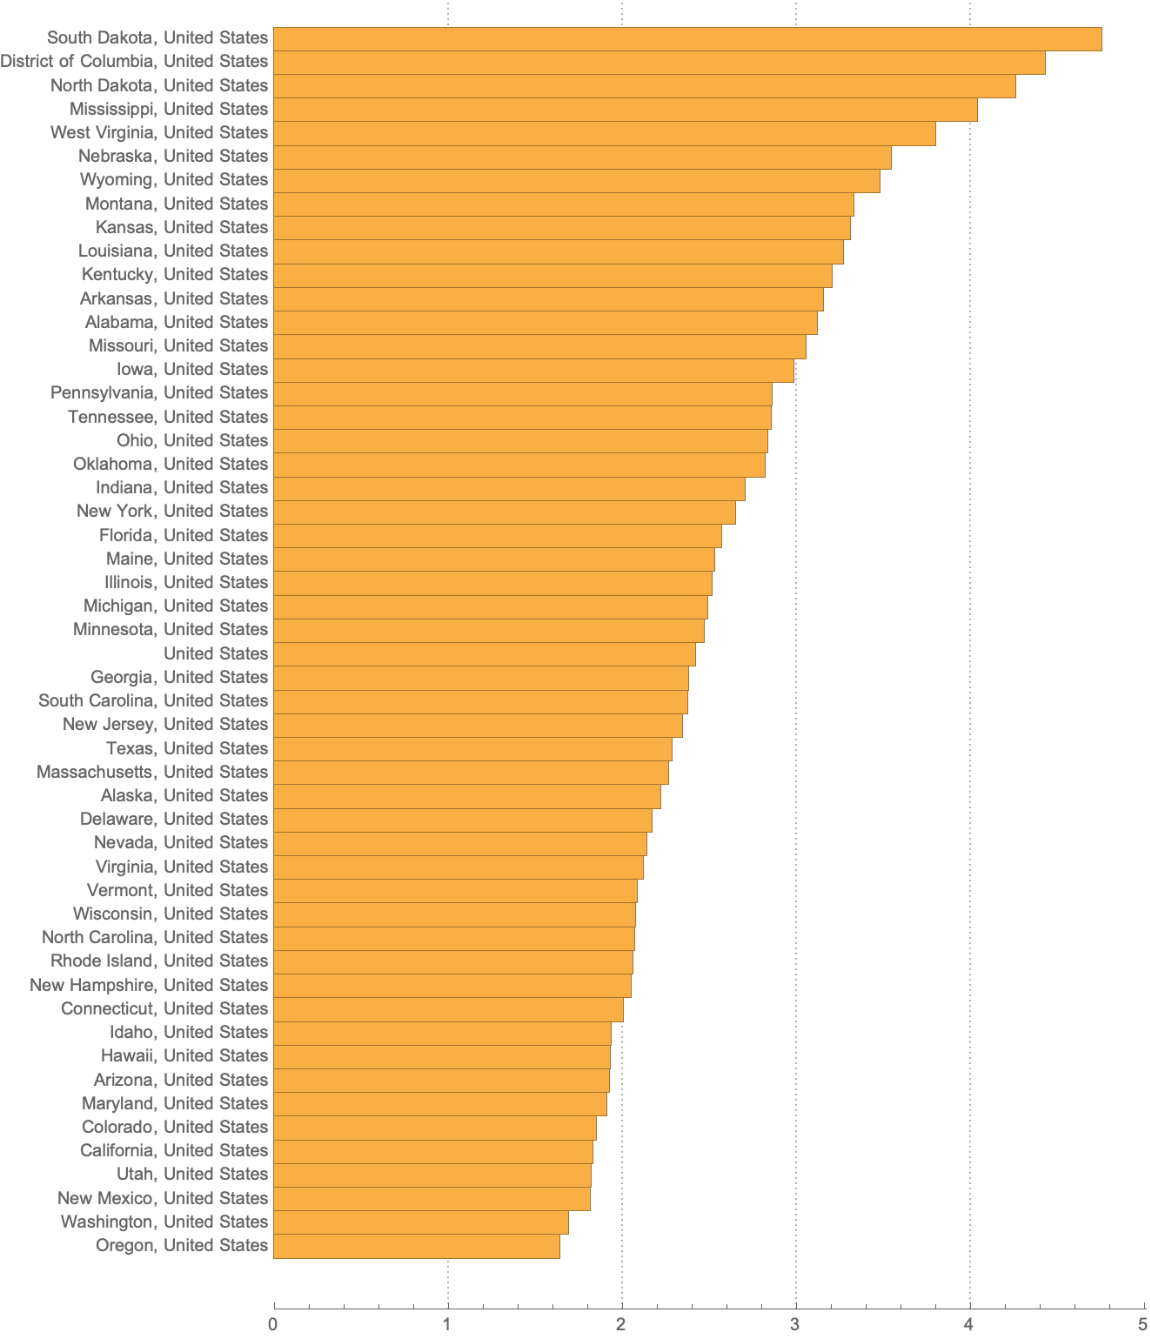 |
Show on a map the last available value of total number of beds per 1000 inhabitants by state :
| In[4]:= | ![GeoRegionValuePlot[
DeleteCases[
Normal[{#["Location"], #["TotalBedsPer1000Inhabitants"][
"LastValue"]} & /@ ResourceData[\!\(\*
TagBox[
RowBox[{"ResourceObject", "[", "\"\<Hospital Beds Per US State\>\"", "]"}],
#& ,
BoxID -> "ResourceTag-Hospital Beds Per US State-Input",
AutoDelete->True]\)]], {Entity["Country", "UnitedStates"], _}]]](https://www.wolframcloud.com/obj/resourcesystem/images/e8e/e8e71ade-ac45-4a8a-9e50-84f8b1253ef6/0a8e28e1aa0c2eaf.png) |
| Out[4]= | 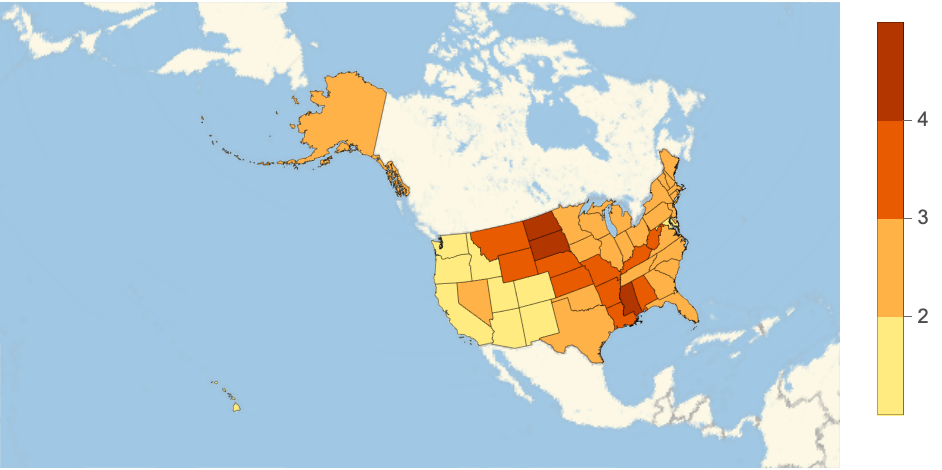 |
Show all time series of total number of beds per 1000 inhabitants:
| In[5]:= |
| Out[5]= | 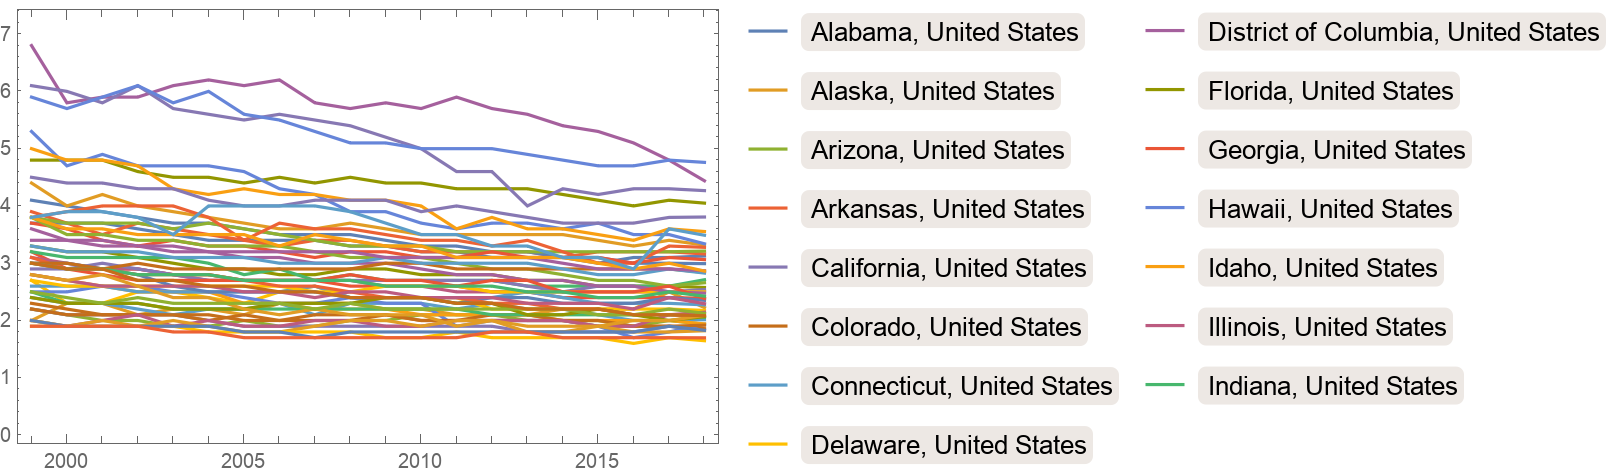 |
Wolfram Research, "Hospital Beds Per US State" from the Wolfram Data Repository (2020)