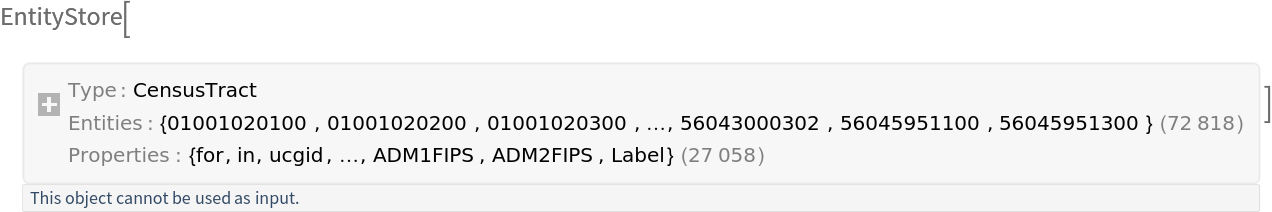
US Census tracts with location, polygon, and data from the American Community Survey
Examples
Scope & Additional Elements (3)
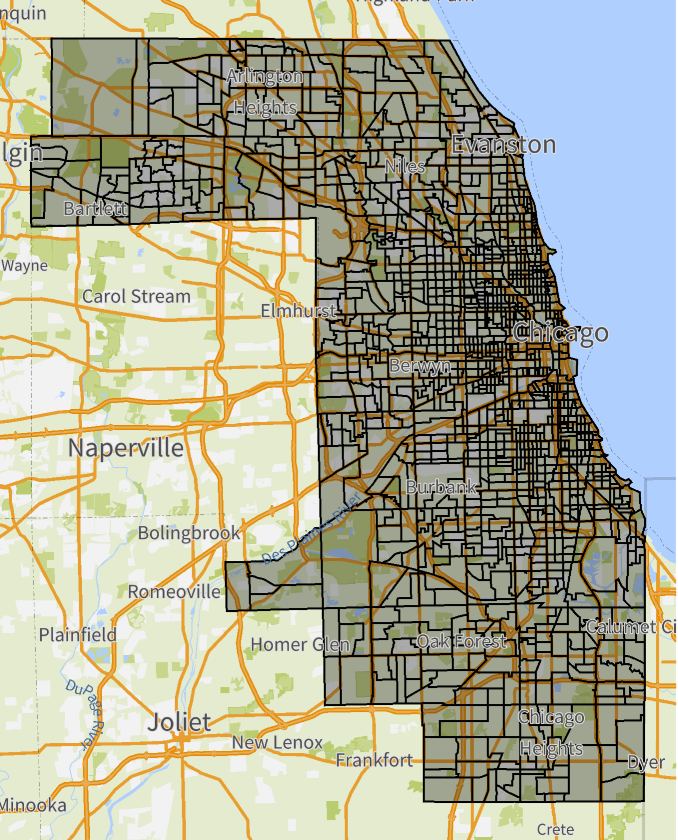
Show census tracts in Cook County, IL:
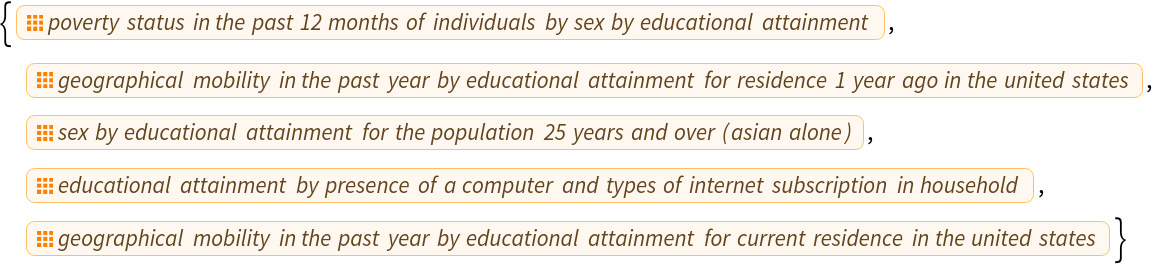
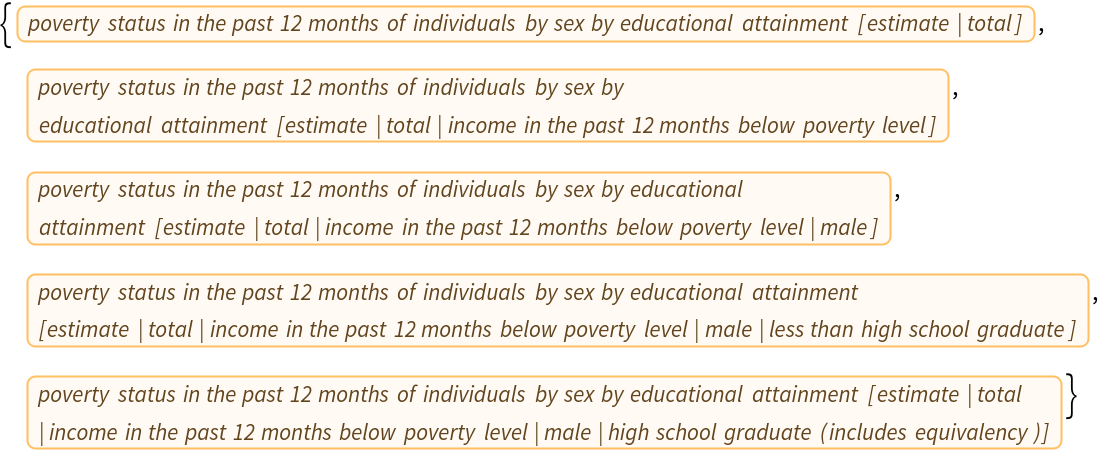
Find property classes matching a particular topic:
List all properties in a property class:
Visualizations (3)
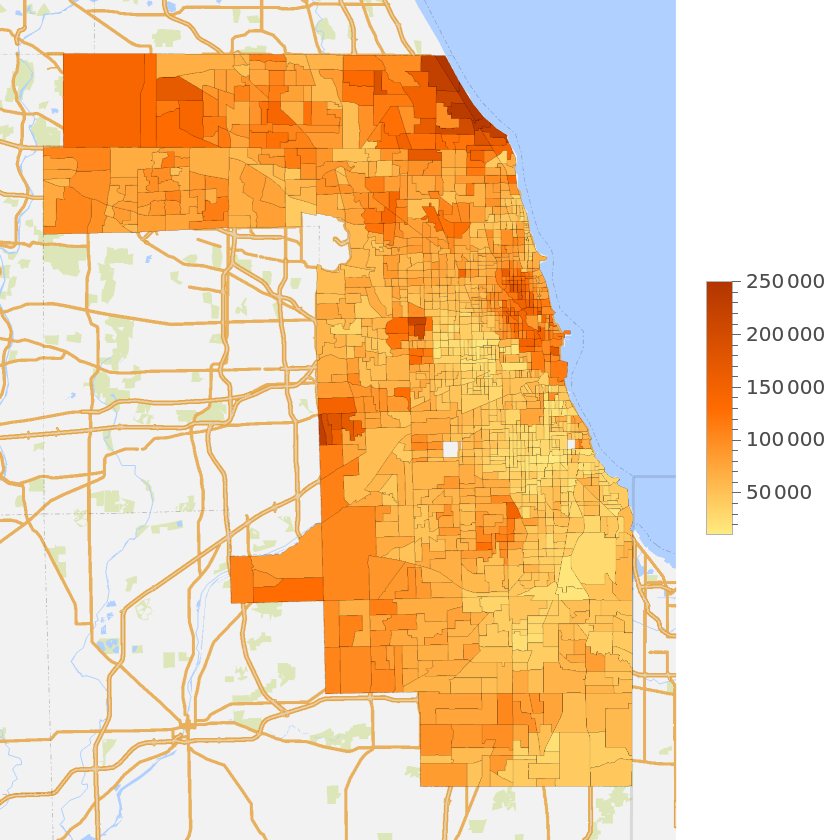
Generate a heat map of median household income in Cook County census tracts:
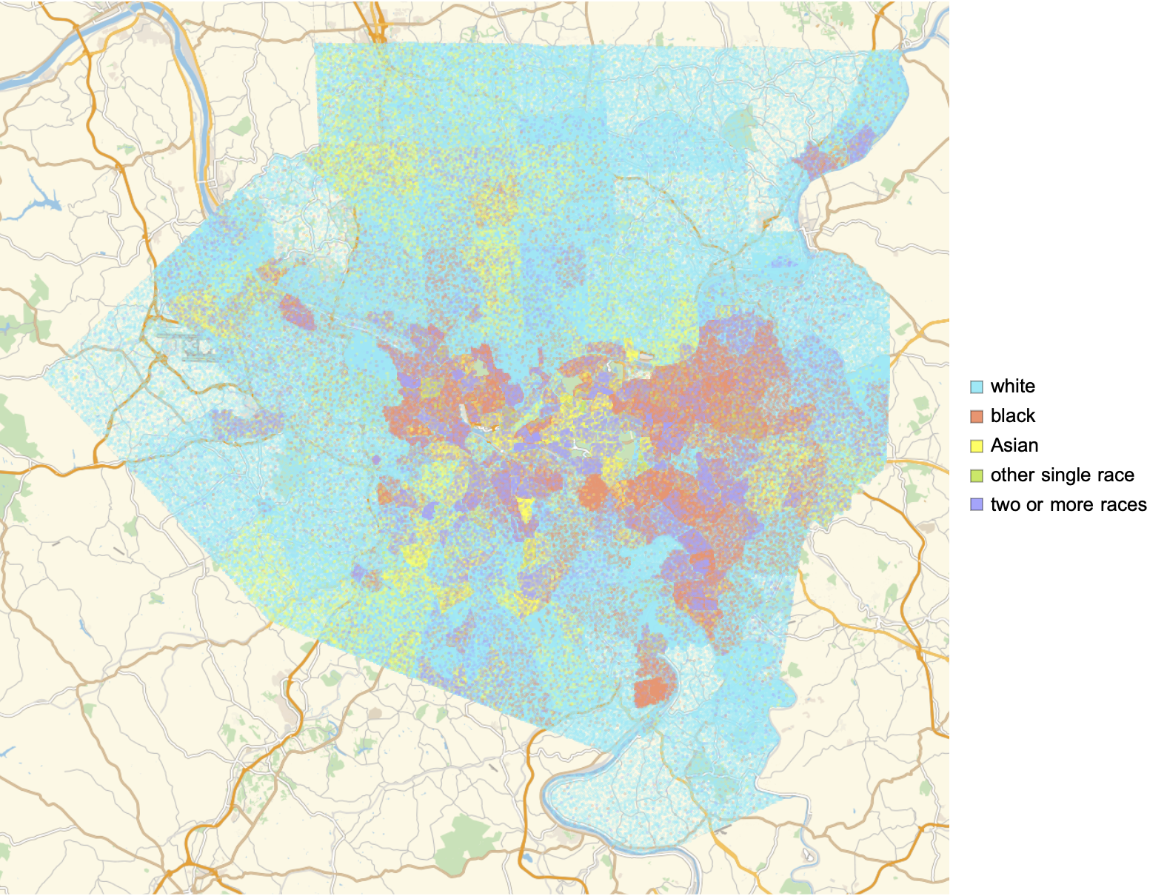
Generate a plot of population by race in a given US county's census tracts (each point represents one person in a given race category, with points randomly distributed within each tract polygon):
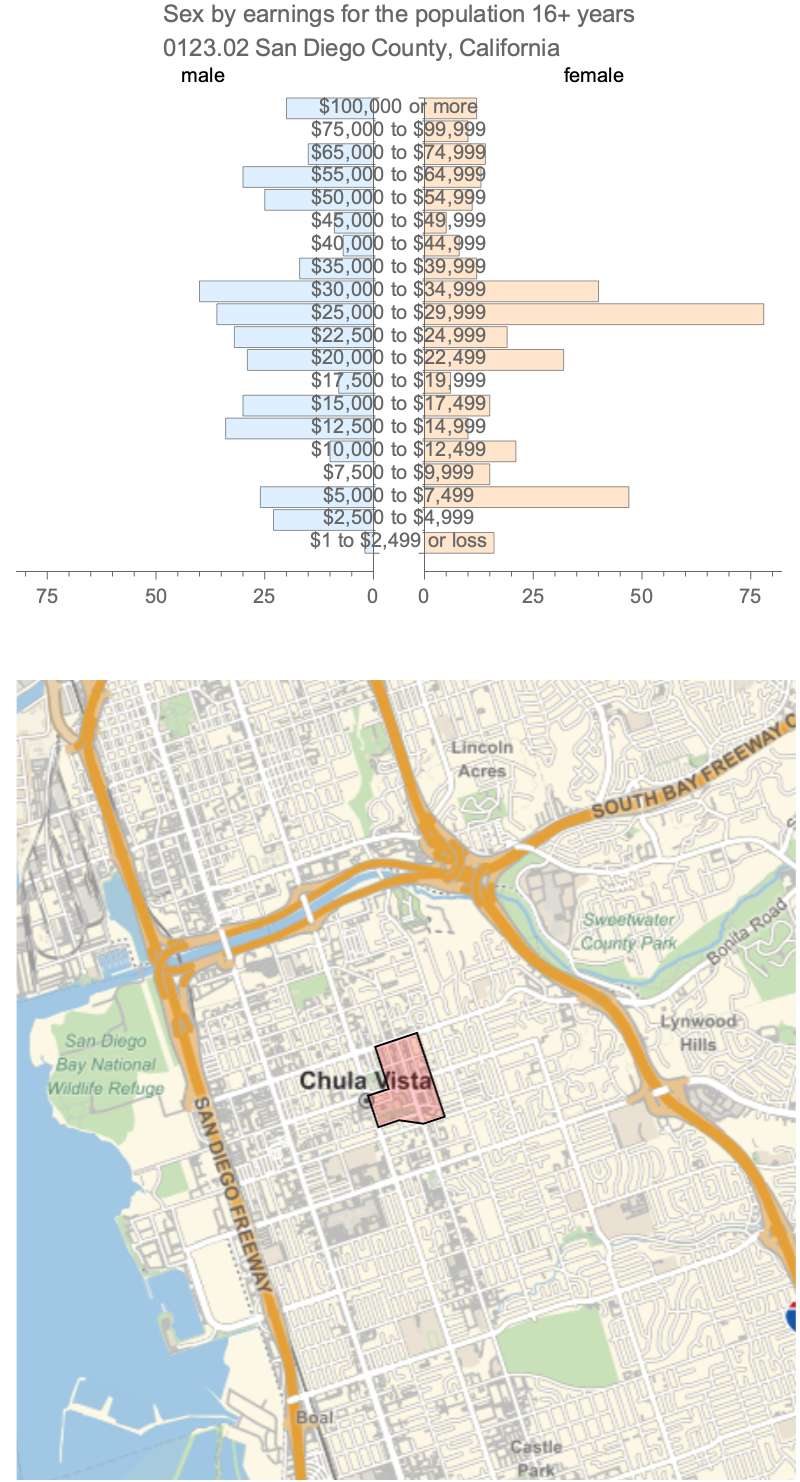
Compare earnings for men and women in a single Census tract:
Analysis (1)
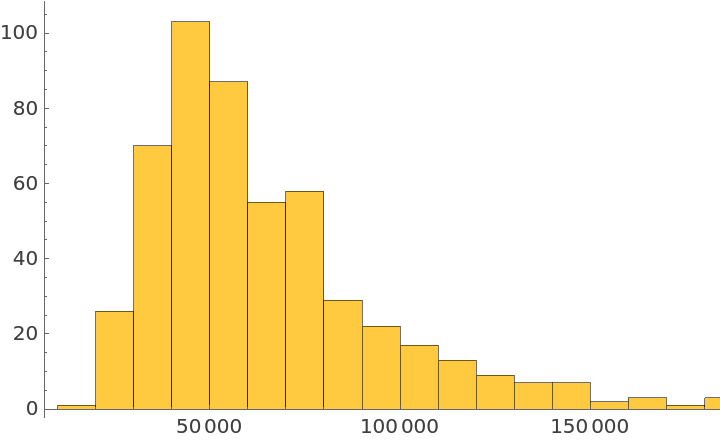
Show an income distribution across Dallas County census tracts:
Bibliographic Citation
Wolfram Research,
"Census Tract Entity Store"
from the Wolfram Data Repository
(2021)
Data Resource History
Publisher Information
![EntityRegister[ResourceData[\!\(\*
TagBox["\"\<Census Tract Entity Store\>\"",
#& ,
BoxID -> "ResourceTag-Census Tract Entity Store-Input",
AutoDelete->True]\)]]; GeoGraphics[{EdgeForm[Black], Polygon@EntityClass["CensusTract", "ADM2" -> Entity["AdministrativeDivision", {"CookCounty", "Illinois", "UnitedStates"}]]}]](https://www.wolframcloud.com/obj/resourcesystem/images/e90/e90a22bc-bbf7-4ead-8fbe-4e104c3349bf/03e792edfbbe3511.png)
![Select[EntityValue["CensusTract", "PropertyClasses"], StringContainsQ[CommonName[#], "educational attainment"] &][[;; 5]]](https://www.wolframcloud.com/obj/resourcesystem/images/e90/e90a22bc-bbf7-4ead-8fbe-4e104c3349bf/519d8b96f6a6c56a.png)
![EntityRegister[ResourceData[\!\(\*
TagBox["\"\<Census Tract Entity Store\>\"",
#& ,
BoxID -> "ResourceTag-Census Tract Entity Store-Input",
AutoDelete->True]\)]]; GeoRegionValuePlot[
EntityValue[
EntityClass["CensusTract", "ADM2" -> Entity["AdministrativeDivision", {"CookCounty", "Illinois", "UnitedStates"}]], EntityProperty["CensusTract", "B19013_001E"],
"Association"]]](https://www.wolframcloud.com/obj/resourcesystem/images/e90/e90a22bc-bbf7-4ead-8fbe-4e104c3349bf/0906470fe87b36df.png)
![EntityRegister[ResourceData[\!\(\*
TagBox["\"\<Census Tract Entity Store\>\"",
#& ,
BoxID -> "ResourceTag-Census Tract Entity Store-Input",
AutoDelete->True]\)]]; Histogram[
EntityValue[
EntityClass["CensusTract", "ADM2" -> Entity["AdministrativeDivision", {"DallasCounty", "Texas", "UnitedStates"}]], EntityProperty["CensusTract", "B19013_001E"]]]](https://www.wolframcloud.com/obj/resourcesystem/images/e90/e90a22bc-bbf7-4ead-8fbe-4e104c3349bf/4adc9b9e3b74e677.png)