Wolfram Data Repository
Immediate Computable Access to Curated Contributed Data
Information on new mothers from 1978 through 1988 from NLSY79
| In[1]:= |
| Out[1]= | 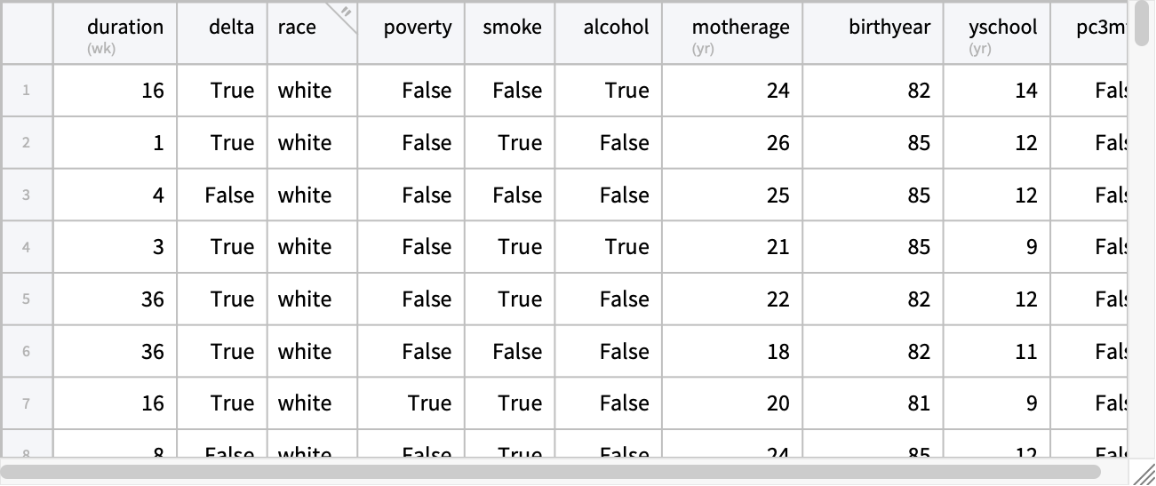 |
Data dimensions:
| In[2]:= |
| Out[2]= |
Column keys and types:
| In[3]:= |
| Out[3]= |
| In[4]:= |
| Out[4]= |  |
Column descriptions:
| In[5]:= |
| Out[5]= | 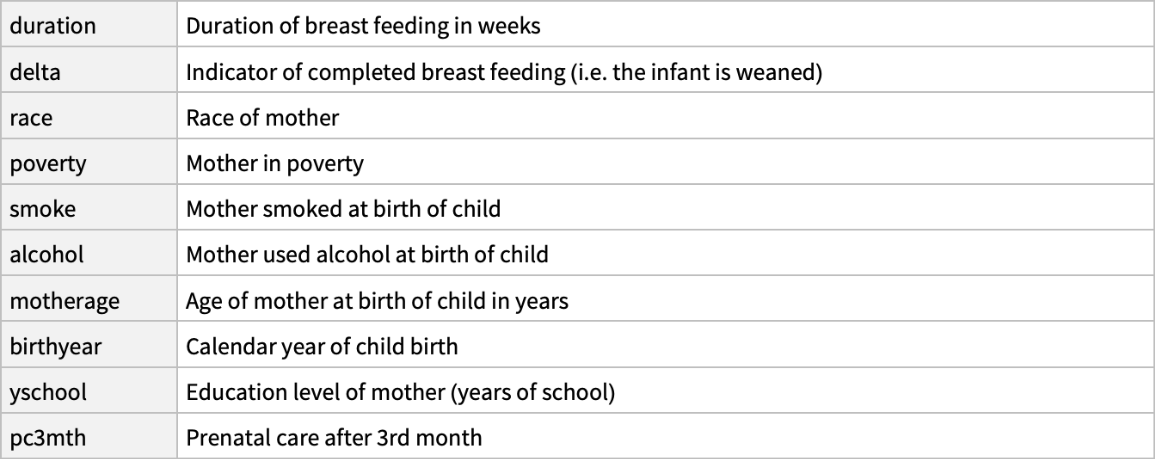 |
Tabular structure of the data:
| In[6]:= |
| Out[6]= | 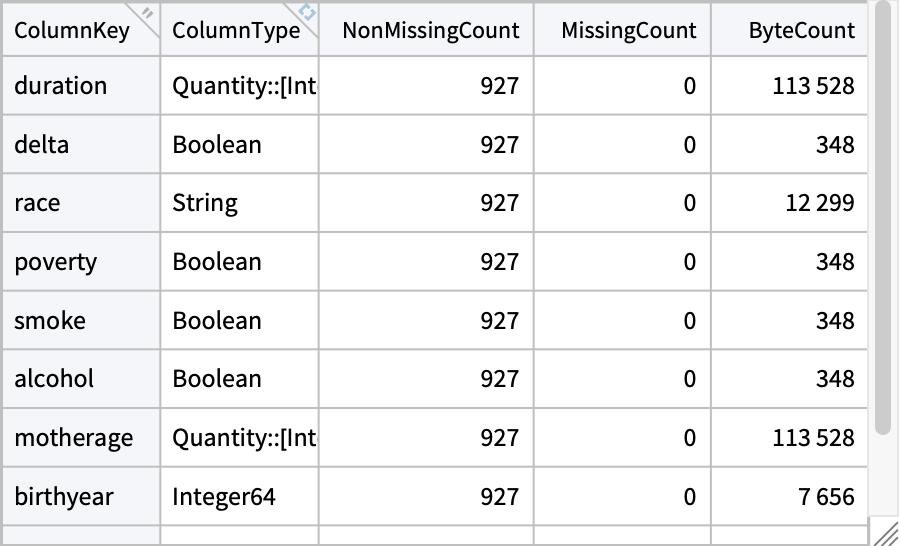 |
Histogram of the breast feeding durations:
| In[7]:= | ![Histogram[ResourceData[\!\(\*
TagBox["\"\<Sample Tabular Data: New Mothers\>\"",
#& ,
BoxID -> "ResourceTag-Sample Tabular Data: New Mothers-Input",
AutoDelete->True]\)] -> "duration", AxesLabel -> Automatic]](https://www.wolframcloud.com/obj/resourcesystem/images/f87/f87ed6d9-d3ab-49df-a01f-6635c06ba3dc/2ceefe6304d4929a.png) |
| Out[7]= | 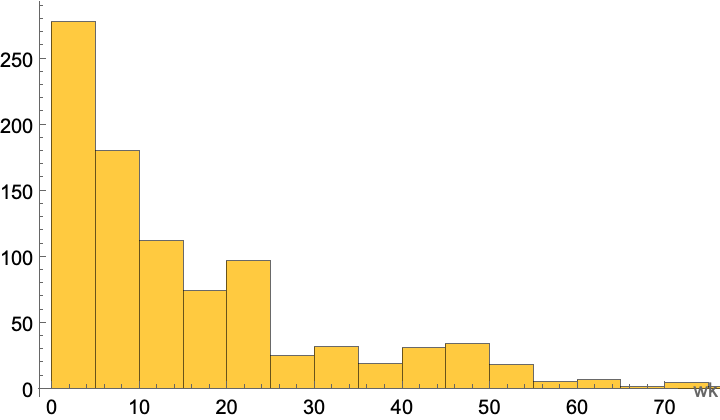 |
PieChart of the race distribution:
| In[8]:= | ![rc = AggregateRows[ResourceData[\!\(\*
TagBox["\"\<Sample Tabular Data: New Mothers\>\"",
#& ,
BoxID -> "ResourceTag-Sample Tabular Data: New Mothers-Input",
AutoDelete->True]\)], "count" -> Function[Length[#race]], "race"]](https://www.wolframcloud.com/obj/resourcesystem/images/f87/f87ed6d9-d3ab-49df-a01f-6635c06ba3dc/64d1c7503d67c0f7.png) |
| Out[8]= | 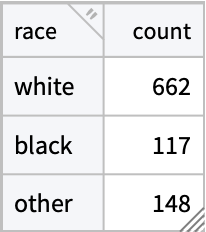 |
| In[9]:= |
| Out[9]= | 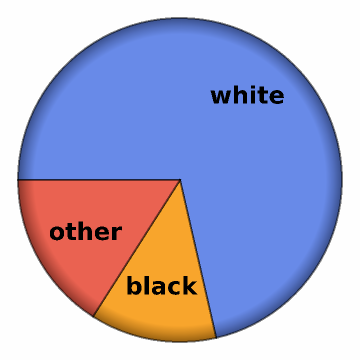 |
Convert "birthyear" column to a date format:
| In[10]:= | ![TransformColumns[ResourceData[\!\(\*
TagBox["\"\<Sample Tabular Data: New Mothers\>\"",
#& ,
BoxID -> "ResourceTag-Sample Tabular Data: New Mothers-Input",
AutoDelete->True]\)], "birthyear" -> Function[DateObject[{1900 + #birthyear}, "Year"]]]](https://www.wolframcloud.com/obj/resourcesystem/images/f87/f87ed6d9-d3ab-49df-a01f-6635c06ba3dc/33a309550274a42b.png) |
| Out[10]= | 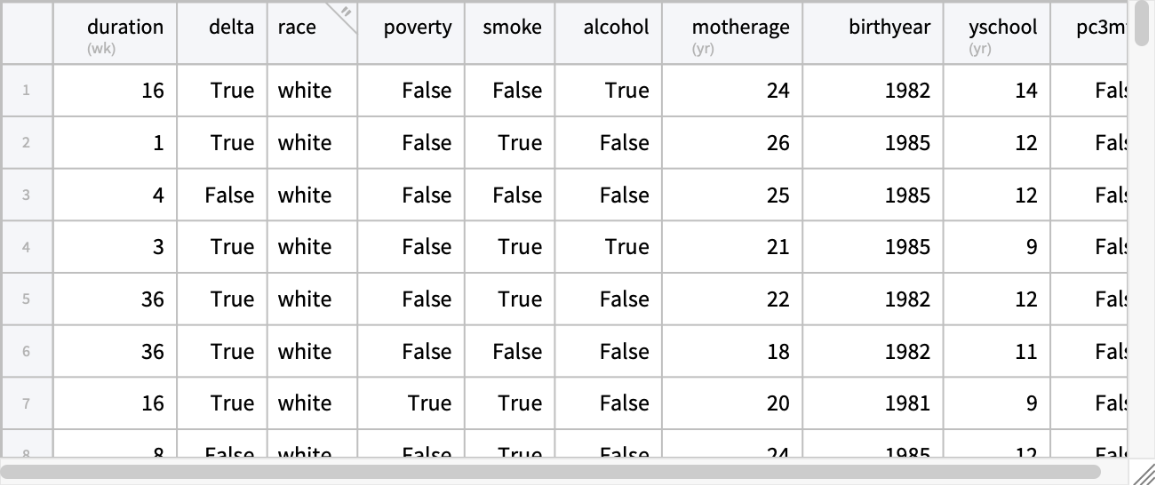 |
| In[11]:= |
| Out[11]= |
Compute mean breast feeding duration grouped by mother's age:
| In[12]:= | ![AggregateRows[ResourceData[\!\(\*
TagBox["\"\<Sample Tabular Data: New Mothers\>\"",
#& ,
BoxID -> "ResourceTag-Sample Tabular Data: New Mothers-Input",
AutoDelete->True]\)], "MeanDuration" -> Function[Mean[#duration]], "motherage"]](https://www.wolframcloud.com/obj/resourcesystem/images/f87/f87ed6d9-d3ab-49df-a01f-6635c06ba3dc/530312af9fcb5f34.png) |
| Out[12]= | 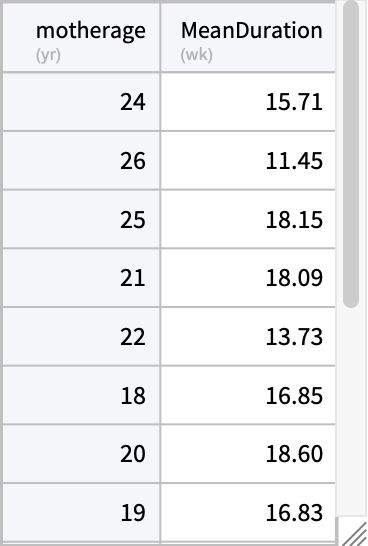 |
Sort by the mother's age:
| In[13]:= |
| Out[13]= | 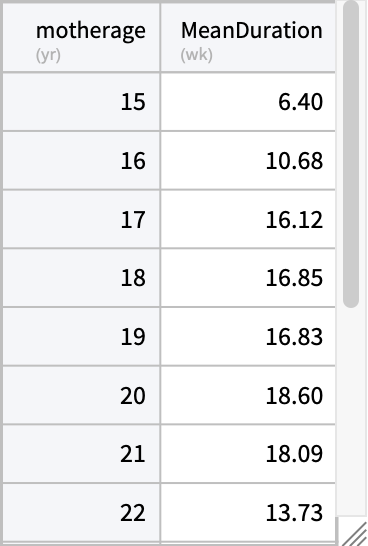 |
Visualize the mean breast feeding duration as a function of mother's age:
| In[14]:= |
| Out[14]= | 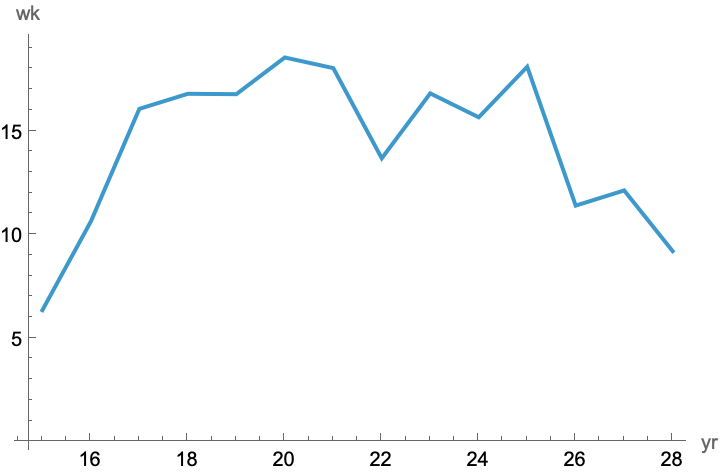 |
Compute mean breast feeding duration grouped by year of birth of child and alcohol use:
| In[15]:= | ![PivotTable[ResourceData[\!\(\*
TagBox["\"\<Sample Tabular Data: New Mothers\>\"",
#& ,
BoxID -> "ResourceTag-Sample Tabular Data: New Mothers-Input",
AutoDelete->True]\)], "MeanDuration" -> Function[Mean[#duration]], "birthyear", "alcohol"]](https://www.wolframcloud.com/obj/resourcesystem/images/f87/f87ed6d9-d3ab-49df-a01f-6635c06ba3dc/148d592c690a7cef.png) |
| Out[15]= | 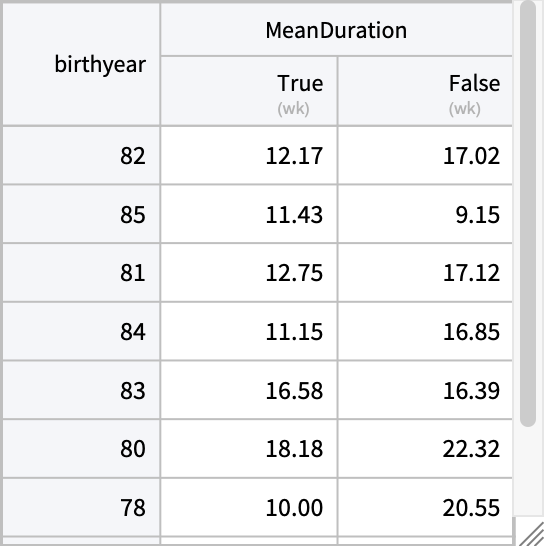 |
Sort by the birth year:
| In[16]:= |
| Out[16]= | 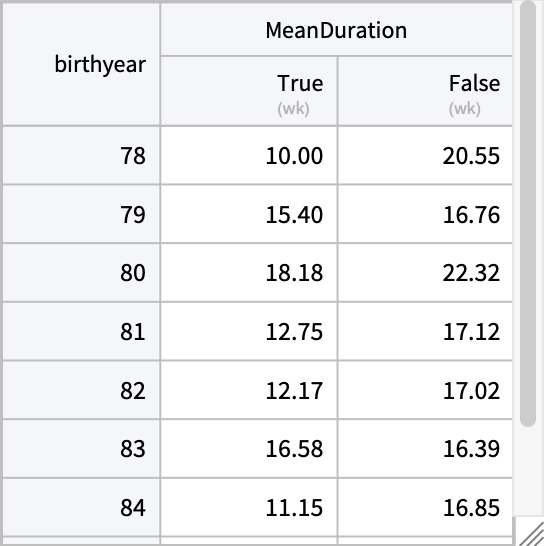 |
Visualize the mean breast feeding durations as a function of child birth year and alcohol use:
| In[17]:= | ![ListLinePlot[
mdb -> {{"birthyear", ExtendedKey["MeanDuration", True]}, {"birthyear", ExtendedKey["MeanDuration", False]}}, AxesLabel -> {"year", Automatic}, PlotLegends -> {"alcohol use", "no alcohol use"}]](https://www.wolframcloud.com/obj/resourcesystem/images/f87/f87ed6d9-d3ab-49df-a01f-6635c06ba3dc/6593837b9dcaec8b.png) |
| Out[17]= | 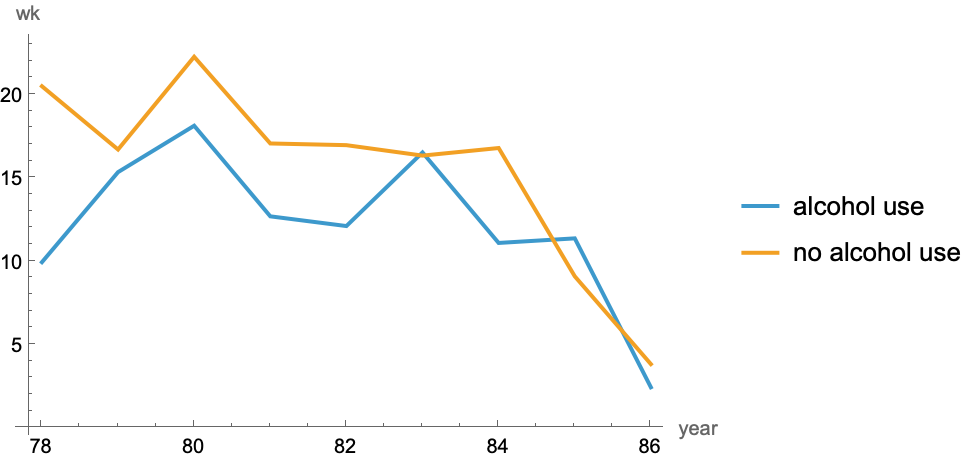 |
Compute how many new mothers smoked and/or used alcohol at birth of child:
| In[18]:= | ![pt = PivotTable[ResourceData[\!\(\*
TagBox["\"\<Sample Tabular Data: New Mothers\>\"",
#& ,
BoxID -> "ResourceTag-Sample Tabular Data: New Mothers-Input",
AutoDelete->True]\)], {"smoked" -> (Length[#smoke] &)}, "alcohol", "smoke", IncludeGroupAggregates -> True]](https://www.wolframcloud.com/obj/resourcesystem/images/f87/f87ed6d9-d3ab-49df-a01f-6635c06ba3dc/1e7ccd6cccb679f4.png) |
| Out[18]= | 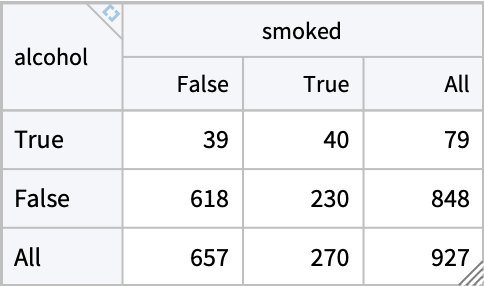 |
The resulting pivot table has a key column and therefore has row keys:
| In[19]:= |
| Out[19]= |
Use RowKey and ExtendedKey to extract values from the pivot table:
| In[20]:= |
| Out[20]= |
| In[21]:= |
| Out[21]= |
| In[22]:= |
| Out[22]= |
Create Venn diagram:
| In[23]:= | ![smoke = Disk[{0.5, 0}];
alcohol = Disk[{-0.5, 0}];
subsets = Subsets[{smoke, alcohol}, {1, 2}];](https://www.wolframcloud.com/obj/resourcesystem/images/f87/f87ed6d9-d3ab-49df-a01f-6635c06ba3dc/0e70c49deb9f7e71.png) |
| In[24]:= | ![subsetscolors = Function[cd, {cd[1], cd[2], Blend[{cd[1], cd[2]}]}][ColorData[93]];
labels = (Placed[Style[Column[#, Alignment -> Center], 16, Bold], Center, Background -> None] & /@ {{"smoke", allSmoked}, {"alcohol", allAlcohol}, {"alcohol", "and", "smoke",
allSmokedAndAlcohol}});](https://www.wolframcloud.com/obj/resourcesystem/images/f87/f87ed6d9-d3ab-49df-a01f-6635c06ba3dc/09dd699d4621052a.png) |
| In[25]:= | ![RegionPlot[
Evaluate[
DiscretizeRegion[
RegionDifference[BooleanRegion[And, #], BooleanRegion[Or, Complement[{smoke, alcohol, EmptyRegion[2]}, #]]]] & /@ subsets], PlotLabels -> labels, PlotStyle -> subsetscolors, BoundaryStyle -> Directive[White, Thickness[.0085]], Frame -> False, PerformanceGoal -> "Speed", AspectRatio -> .7]](https://www.wolframcloud.com/obj/resourcesystem/images/f87/f87ed6d9-d3ab-49df-a01f-6635c06ba3dc/54b193384ec55bf3.png) |
| Out[25]= | 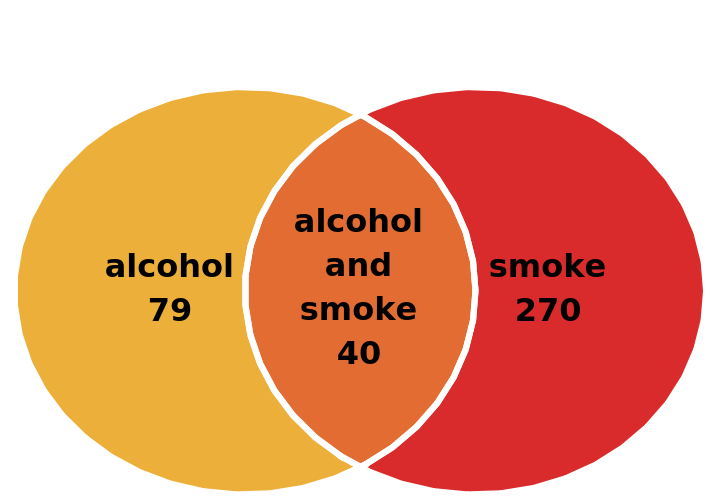 |
Gosia Konwerska, "Sample Tabular Data: New Mothers" from the Wolfram Data Repository (2025)