Wolfram Data Repository
Immediate Computable Access to Curated Contributed Data
Palmer penguins data
| In[1]:= |
| Out[1]= | 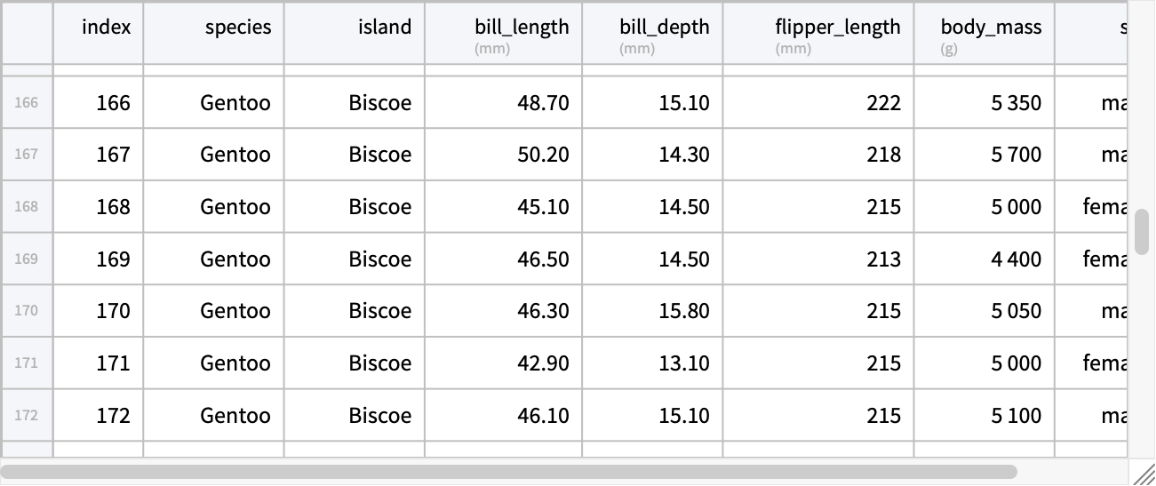 |
Dimensions:
| In[2]:= |
| Out[2]= |
Column keys and types:
| In[3]:= |
| Out[3]= |
| In[4]:= |
| Out[4]= |  |
Tally each species per island:
| In[5]:= | ![AggregateRows[ResourceData[\!\(\*
TagBox["\"\<Sample Tabular Data: Palmer Penguins\>\"",
#& ,
BoxID -> "ResourceTag-Sample Tabular Data: Palmer Penguins-Input",
AutoDelete->True]\)], "species_count" -> Function[Length[#species]], {"species", "island"}]](https://www.wolframcloud.com/obj/resourcesystem/images/fac/fac757dd-7422-4f5d-b9d6-818ae707502b/2ae96d534a4313e3.png) |
| Out[5]= | 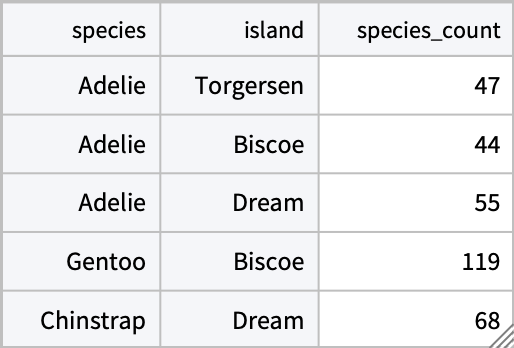 |
Find the mean body weight and max bill length for each species and each sex:
| In[6]:= | ![AggregateRows[ResourceData[\!\(\*
TagBox["\"\<Sample Tabular Data: Palmer Penguins\>\"",
#& ,
BoxID -> "ResourceTag-Sample Tabular Data: Palmer Penguins-Input",
AutoDelete->True]\)], {"body_mass_mean" -> Function[Mean[#"body_mass"]], "max_bill_length" -> Function[Max[#"bill_length"]]}, {"species", "sex"}]](https://www.wolframcloud.com/obj/resourcesystem/images/fac/fac757dd-7422-4f5d-b9d6-818ae707502b/476826c5d2462d74.png) |
| Out[6]= | 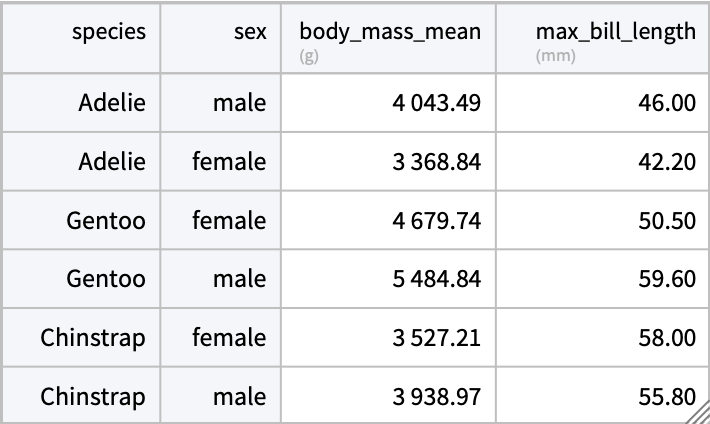 |
Find the mean body weight of each species at each island:
| In[7]:= | ![PivotTable[ResourceData[\!\(\*
TagBox["\"\<Sample Tabular Data: Palmer Penguins\>\"",
#& ,
BoxID -> "ResourceTag-Sample Tabular Data: Palmer Penguins-Input",
AutoDelete->True]\)], Function[Mean[#"body_mass"]], "species", "island"]](https://www.wolframcloud.com/obj/resourcesystem/images/fac/fac757dd-7422-4f5d-b9d6-818ae707502b/19744121fa4f16b8.png) |
| Out[7]= | 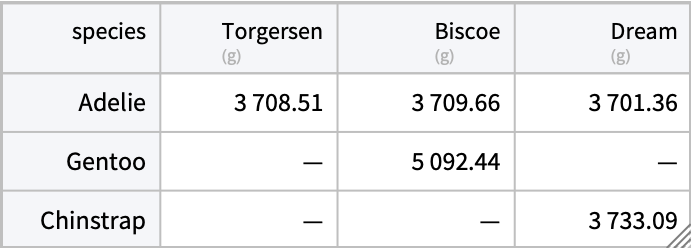 |
Number of each species:
| In[8]:= |
| Out[8]= | 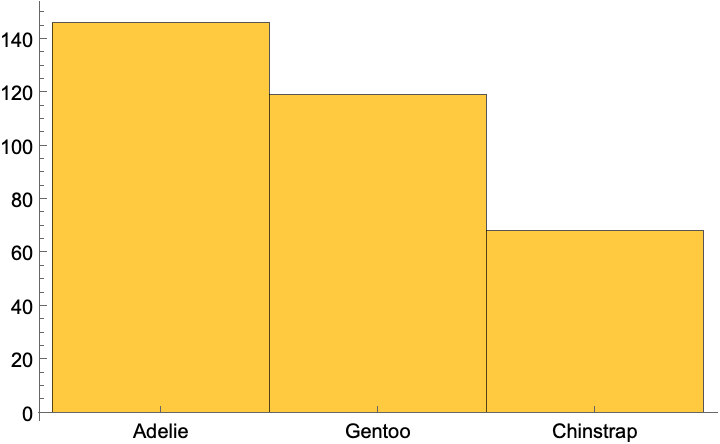 |
Number of penguins on each island:
| In[9]:= | ![AggregateRows[ResourceData[\!\(\*
TagBox["\"\<Sample Tabular Data: Palmer Penguins\>\"",
#& ,
BoxID -> "ResourceTag-Sample Tabular Data: Palmer Penguins-Input",
AutoDelete->True]\)], "count" -> Function[Length[#island]], "island"]](https://www.wolframcloud.com/obj/resourcesystem/images/fac/fac757dd-7422-4f5d-b9d6-818ae707502b/139db9151d636d8c.png) |
| Out[9]= | 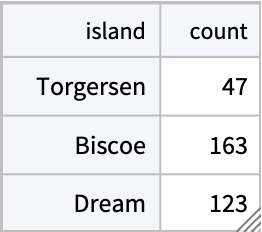 |
| In[10]:= |
| Out[10]= | 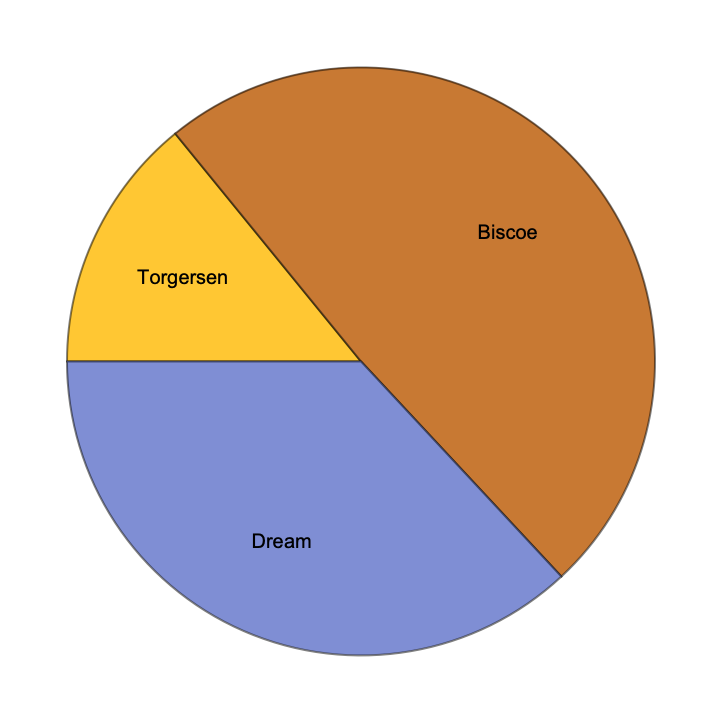 |
Plot bill depth vs bill length for each penguin species:
| In[11]:= | ![ppenguins = PivotToColumns[ResourceData[\!\(\*
TagBox["\"\<Sample Tabular Data: Palmer Penguins\>\"",
#& ,
BoxID -> "ResourceTag-Sample Tabular Data: Palmer Penguins-Input",
AutoDelete->True]\)], "species" -> {"bill_length", "bill_depth"}];
ListPlot[
ppenguins -> {{ExtendedKey["bill_length", "Adelie"], ExtendedKey["bill_depth", "Adelie"]}, {ExtendedKey["bill_length", "Gentoo"], ExtendedKey["bill_depth", "Gentoo"]}, {ExtendedKey["bill_length", "Chinstrap"], ExtendedKey["bill_depth", "Chinstrap"]}}, AxesLabel -> {"bill_length", "bill_depth"}, PlotLegends -> {"Adelie", "Gentoo", "Chinstrap"}]](https://www.wolframcloud.com/obj/resourcesystem/images/fac/fac757dd-7422-4f5d-b9d6-818ae707502b/57f1e75496602499.png) |
| Out[12]= | 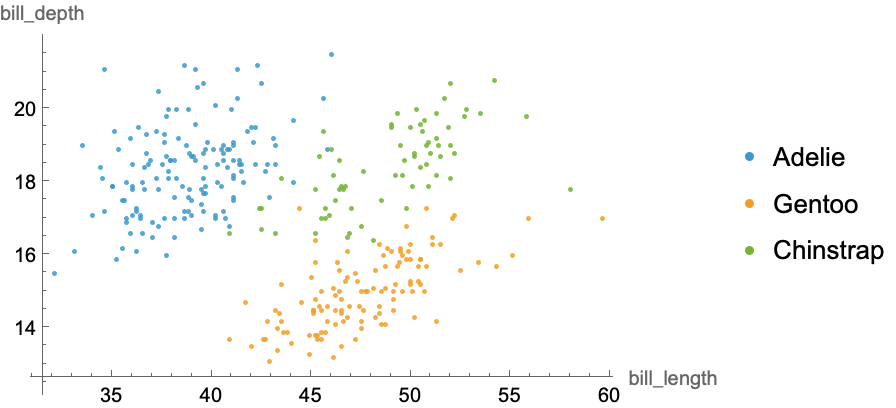 |
Gosia Konwerska, "Sample Tabular Data: Palmer Penguins" from the Wolfram Data Repository (2024)