Basic Examples (2)
Retrieve the graph:
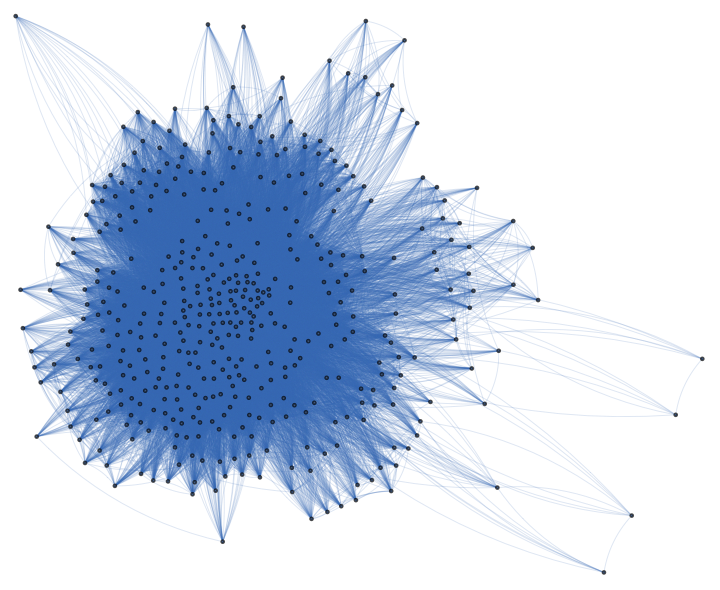
Plot the graph:
Scope & Additional Elements (10)
Retrieve the adjacency matrix:
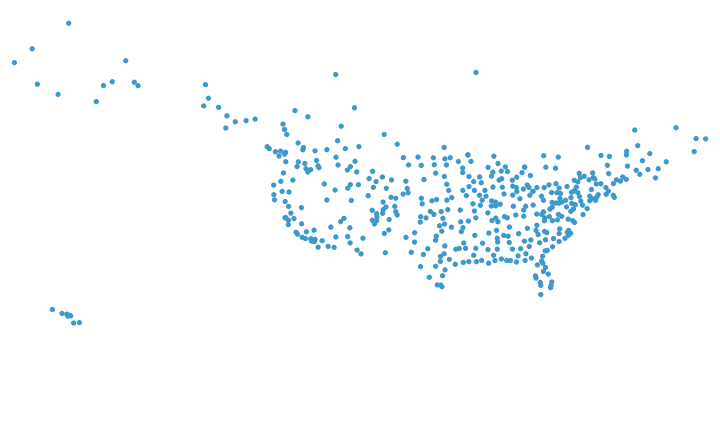
Retrieve the node positions:
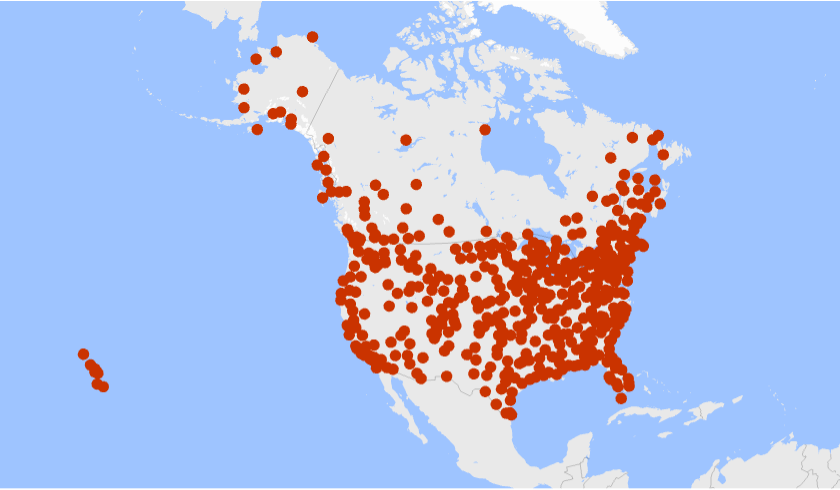
Retrieve geographic positions and generate a GeoListPlot:
Plot the graph using the adjacency matrix:
Using node names, compute the number of airports per state:
List the names of the first 50 cities:
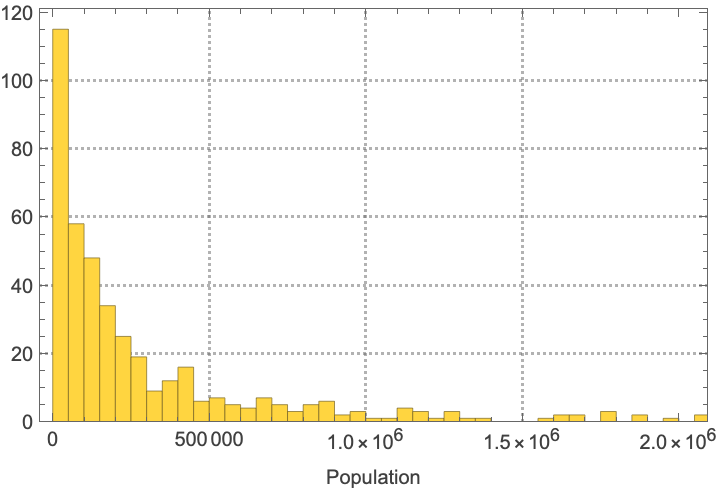
Plot a histogram of city populations:
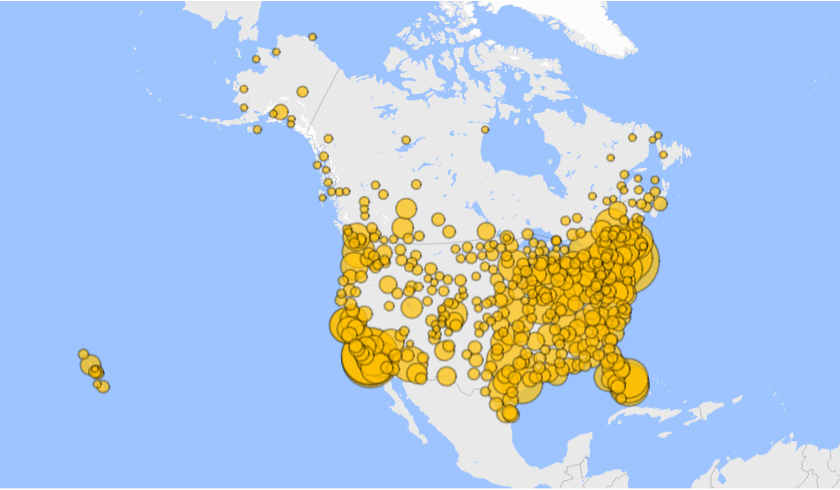
Generate the GeoBubbleChart using population as bubble size:
Identify the cities with the largest populations:
Identify the nodes with the highest vertex degree:
Visualizations (4)
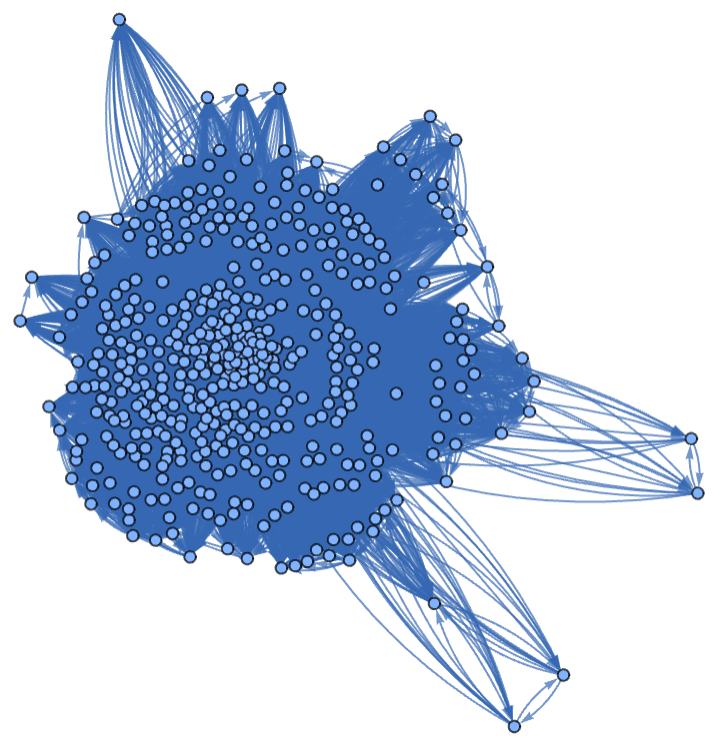
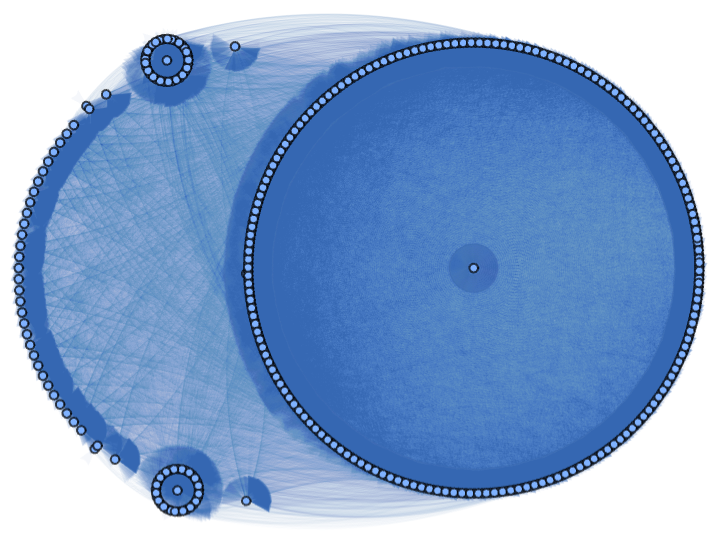
Plot the graph using a different GraphLayout:
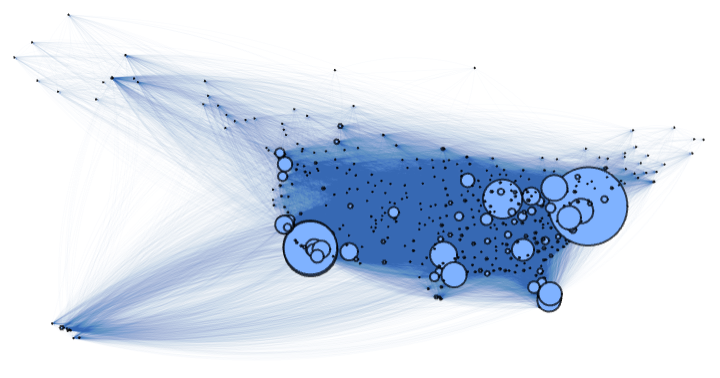
Plot the graph with vertex size proportional to population:
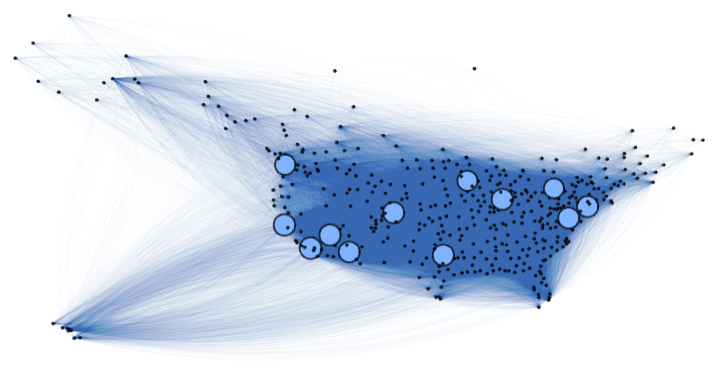
Plot the graph highlighting nodes with the highest vertex degree:
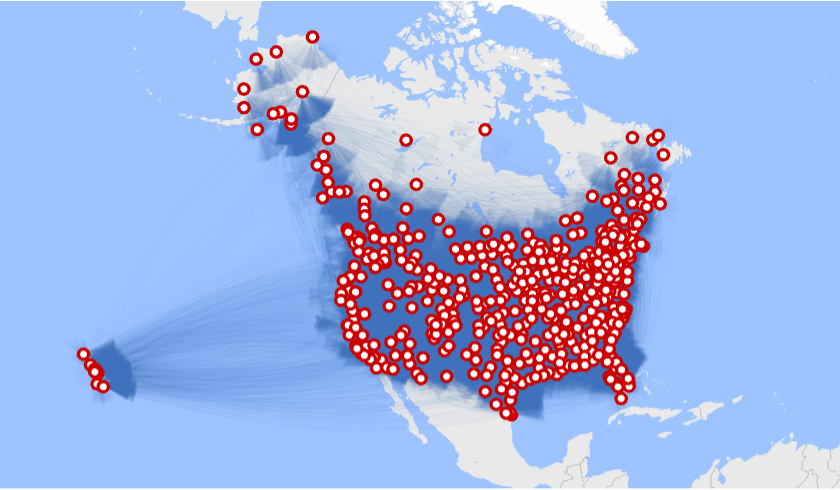
Generate a GeoGraphPlot:
Analysis (8)
Compute the vertex count:
Compute the edge count:
Compute the graph diameter:
Compute the graph radius:
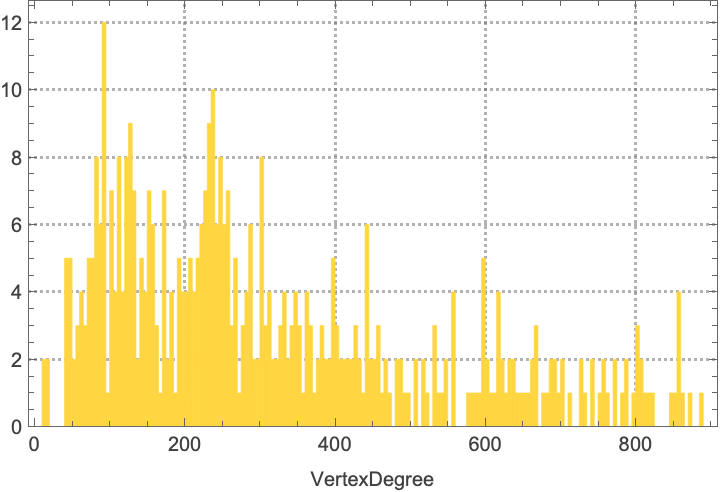
Plot a histogram of the vertex degree distribution:
Compute pairwise distances between nodes using GeoDistance:
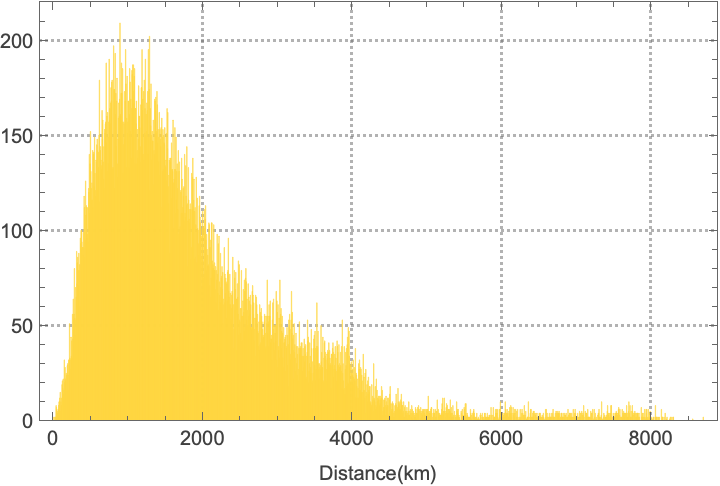
Plot a histogram of the distances:
Compute pairwise geographic distances using GeoDistance:
Identify the most distant city pairs:
Visualize the most distant city pairs in a plot:
Identify the closest city pairs:
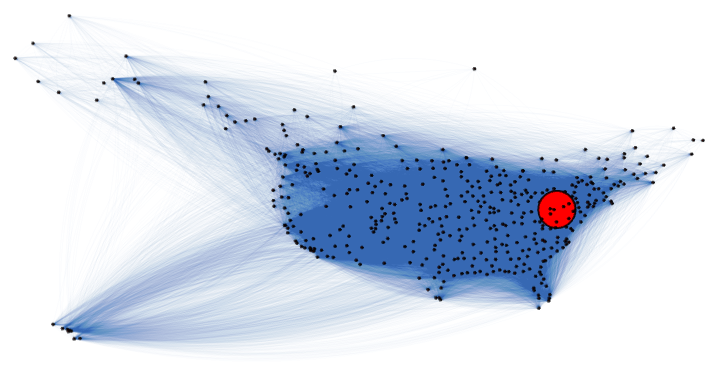
Visualize the closest city pairs in a plot:
Detect vertex communities:
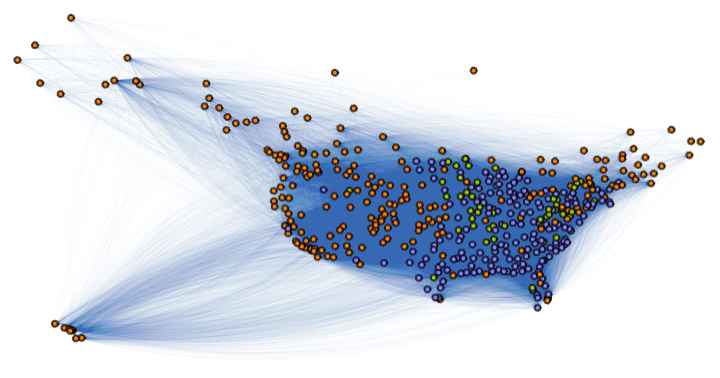
Plot the communities in their geographic positions:

![GraphPlot[ResourceData[\!\(\*
TagBox["\"\<North American Airline Reachability Network\>\"",
#& ,
BoxID -> "ResourceTag-North American Airline Reachability Network-Input",
AutoDelete->True]\), "Adjacency Matrix"], Sequence[
GraphLayout -> "GravityEmbedding", EdgeStyle -> Directive[Thin,
Opacity[0.4]], VertexSize -> 0.5]]](https://www.wolframcloud.com/obj/resourcesystem/images/fb0/fb0390ad-0129-4cc4-a61e-ff743b54eabb/2ab609f71339a91d.png)
![Counts[StringTake[ResourceData[\!\(\*
TagBox["\"\<North American Airline Reachability Network\>\"",
#& ,
BoxID -> "ResourceTag-North American Airline Reachability Network-Input",
AutoDelete->True]\), "Node name"], -2]]](https://www.wolframcloud.com/obj/resourcesystem/images/fb0/fb0390ad-0129-4cc4-a61e-ff743b54eabb/33e5563b1640e2c7.png)


![GeoBubbleChart[Thread[Thread[ResourceData[\!\(\*
TagBox["\"\<North American Airline Reachability Network\>\"",
#& ,
BoxID -> "ResourceTag-North American Airline Reachability Network-Input",
AutoDelete->True]\), "GeoPosition"]] -> ResourceData[\!\(\*
TagBox["\"\<North American Airline Reachability Network\>\"",
#& ,
BoxID -> "ResourceTag-North American Airline Reachability Network-Input",
AutoDelete->True]\), "Population"]/30000]]](https://www.wolframcloud.com/obj/resourcesystem/images/fb0/fb0390ad-0129-4cc4-a61e-ff743b54eabb/25059f1bad33630b.png)
![TakeLargestBy[Transpose[{ResourceData[\!\(\*
TagBox["\"\<North American Airline Reachability Network\>\"",
#& ,
BoxID -> "ResourceTag-North American Airline Reachability Network-Input",
AutoDelete->True]\), "Node name"], ResourceData[\!\(\*
TagBox["\"\<North American Airline Reachability Network\>\"",
#& ,
BoxID -> "ResourceTag-North American Airline Reachability Network-Input",
AutoDelete->True]\), "Population"]}], Last, 10]](https://www.wolframcloud.com/obj/resourcesystem/images/fb0/fb0390ad-0129-4cc4-a61e-ff743b54eabb/5a8f74358db209ce.png)

![TakeLargestBy[Transpose[{ResourceData[\!\(\*
TagBox["\"\<North American Airline Reachability Network\>\"",
#& ,
BoxID -> "ResourceTag-North American Airline Reachability Network-Input",
AutoDelete->True]\), "Node name"], VertexDegree[ResourceData[\!\(\*
TagBox["\"\<North American Airline Reachability Network\>\"",
#& ,
BoxID -> "ResourceTag-North American Airline Reachability Network-Input",
AutoDelete->True]\)]]}], Last, 10]](https://www.wolframcloud.com/obj/resourcesystem/images/fb0/fb0390ad-0129-4cc4-a61e-ff743b54eabb/12637c4464c45232.png)

![GraphPlot[ResourceData[\!\(\*
TagBox["\"\<North American Airline Reachability Network\>\"",
#& ,
BoxID -> "ResourceTag-North American Airline Reachability Network-Input",
AutoDelete->True]\)], GraphLayout -> "BalloonEmbedding", Sequence[
EdgeStyle -> Directive[Thin,
Opacity[0.05]], VertexSize -> 3]]](https://www.wolframcloud.com/obj/resourcesystem/images/fb0/fb0390ad-0129-4cc4-a61e-ff743b54eabb/683d79fe1b3a731b.png)
![GraphPlot[ResourceData[\!\(\*
TagBox["\"\<North American Airline Reachability Network\>\"",
#& ,
BoxID -> "ResourceTag-North American Airline Reachability Network-Input",
AutoDelete->True]\)], VertexCoordinates -> Thread[Range[
Length[
ResourceData[
ResourceObject[
EvaluationNotebook[]], "Position"]]] -> ResourceData[\!\(\*
TagBox["\"\<North American Airline Reachability Network\>\"",
#& ,
BoxID -> "ResourceTag-North American Airline Reachability Network-Input",
AutoDelete->True]\), "Position"]], EdgeStyle -> Directive[Thin,
Opacity[0.05]], VertexSize -> Thread[Range[
Length[
ResourceData[
ResourceObject[
EvaluationNotebook[]], "Position"]]] -> ResourceData[\!\(\*
TagBox["\"\<North American Airline Reachability Network\>\"",
#& ,
BoxID -> "ResourceTag-North American Airline Reachability Network-Input",
AutoDelete->True]\), "Population"]/30000]]](https://www.wolframcloud.com/obj/resourcesystem/images/fb0/fb0390ad-0129-4cc4-a61e-ff743b54eabb/54f47f4cdba8b3f6.png)
![largestVertexDegree = Flatten[PositionLargest[VertexDegree[ResourceData[\!\(\*
TagBox["\"\<North American Airline Reachability Network\>\"",
#& ,
BoxID -> "ResourceTag-North American Airline Reachability Network-Input",
AutoDelete->True]\)]], 10]];](https://www.wolframcloud.com/obj/resourcesystem/images/fb0/fb0390ad-0129-4cc4-a61e-ff743b54eabb/0f581c19a4246dd4.png)
![GraphPlot[ResourceData[\!\(\*
TagBox["\"\<North American Airline Reachability Network\>\"",
#& ,
BoxID -> "ResourceTag-North American Airline Reachability Network-Input",
AutoDelete->True]\)], VertexCoordinates -> Thread[Range[
Length[
ResourceData[
ResourceObject[
EvaluationNotebook[]], "Position"]]] -> ResourceData[\!\(\*
TagBox["\"\<North American Airline Reachability Network\>\"",
#& ,
BoxID -> "ResourceTag-North American Airline Reachability Network-Input",
AutoDelete->True]\), "Position"]], EdgeStyle -> Directive[Thin,
Opacity[0.05]], VertexSize -> Thread[largestVertexDegree -> (VertexDegree[ResourceData[\!\(\*
TagBox["\"\<North American Airline Reachability Network\>\"",
#& ,
BoxID -> "ResourceTag-North American Airline Reachability Network-Input",
AutoDelete->True]\)]][[largestVertexDegree]])/5]]](https://www.wolframcloud.com/obj/resourcesystem/images/fb0/fb0390ad-0129-4cc4-a61e-ff743b54eabb/63c2eb7636667fa1.png)
![GeoGraphPlot[EdgeList[ResourceData[\!\(\*
TagBox["\"\<North American Airline Reachability Network\>\"",
#& ,
BoxID -> "ResourceTag-North American Airline Reachability Network-Input",
AutoDelete->True]\)]] /. Thread[Range[Length[ResourceData[\!\(\*
TagBox["\"\<North American Airline Reachability Network\>\"",
#& ,
BoxID -> "ResourceTag-North American Airline Reachability Network-Input",
AutoDelete->True]\), "Position"]]] -> ResourceData[\!\(\*
TagBox["\"\<North American Airline Reachability Network\>\"",
#& ,
BoxID -> "ResourceTag-North American Airline Reachability Network-Input",
AutoDelete->True]\), "GeoPosition"]], EdgeStyle -> Directive[Thin,
Opacity[0.05]]]](https://www.wolframcloud.com/obj/resourcesystem/images/fb0/fb0390ad-0129-4cc4-a61e-ff743b54eabb/38477bab44576bc9.png)
![distance = QuantityMagnitude[(GeoDistance @@@ (List @@@ EdgeList[ResourceData[\!\(\*
TagBox["\"\<North American Airline Reachability Network\>\"",
#& ,
BoxID -> "ResourceTag-North American Airline Reachability Network-Input",
AutoDelete->True]\)]] /. Thread[Range[VertexCount[ResourceData[\!\(\*
TagBox["\"\<North American Airline Reachability Network\>\"",
#& ,
BoxID -> "ResourceTag-North American Airline Reachability Network-Input",
AutoDelete->True]\)]]] -> ResourceData[\!\(\*
TagBox["\"\<North American Airline Reachability Network\>\"",
#& ,
BoxID -> "ResourceTag-North American Airline Reachability Network-Input",
AutoDelete->True]\), "GeoPosition"]]))];](https://www.wolframcloud.com/obj/resourcesystem/images/fb0/fb0390ad-0129-4cc4-a61e-ff743b54eabb/5109a3b7b855c81d.png)
![distance = QuantityMagnitude[(GeoDistance @@@ (List @@@ EdgeList[ResourceData[\!\(\*
TagBox["\"\<North American Airline Reachability Network\>\"",
#& ,
BoxID -> "ResourceTag-North American Airline Reachability Network-Input",
AutoDelete->True]\)]] /. Thread[Range[VertexCount[ResourceData[\!\(\*
TagBox["\"\<North American Airline Reachability Network\>\"",
#& ,
BoxID -> "ResourceTag-North American Airline Reachability Network-Input",
AutoDelete->True]\)]]] -> ResourceData[\!\(\*
TagBox["\"\<North American Airline Reachability Network\>\"",
#& ,
BoxID -> "ResourceTag-North American Airline Reachability Network-Input",
AutoDelete->True]\), "GeoPosition"]]))];](https://www.wolframcloud.com/obj/resourcesystem/images/fb0/fb0390ad-0129-4cc4-a61e-ff743b54eabb/097f691f19f96c40.png)
![ResourceData[\!\(\*
TagBox["\"\<North American Airline Reachability Network\>\"",
#& ,
BoxID -> "ResourceTag-North American Airline Reachability Network-Input",
AutoDelete->True]\), "Node name"][[#]] & /@ EdgeList[ResourceData[\!\(\*
TagBox["\"\<North American Airline Reachability Network\>\"",
#& ,
BoxID -> "ResourceTag-North American Airline Reachability Network-Input",
AutoDelete->True]\)]][[PositionLargest[distance], 1]]](https://www.wolframcloud.com/obj/resourcesystem/images/fb0/fb0390ad-0129-4cc4-a61e-ff743b54eabb/6ab0223e81eb1cd7.png)
![GraphPlot[ResourceData[\!\(\*
TagBox["\"\<North American Airline Reachability Network\>\"",
#& ,
BoxID -> "ResourceTag-North American Airline Reachability Network-Input",
AutoDelete->True]\)], VertexCoordinates -> Thread[Range[
Length[
ResourceData[
ResourceObject[
EvaluationNotebook[]], "Position"]]] -> ResourceData[\!\(\*
TagBox["\"\<North American Airline Reachability Network\>\"",
#& ,
BoxID -> "ResourceTag-North American Airline Reachability Network-Input",
AutoDelete->True]\), "Position"]], EdgeStyle -> Directive[Thin,
Opacity[0.05]], VertexSize -> Thread[EdgeList[ResourceData[\!\(\*
TagBox["\"\<North American Airline Reachability Network\>\"",
#& ,
BoxID -> "ResourceTag-North American Airline Reachability Network-Input",
AutoDelete->True]\)]][[PositionLargest[distance], 1]] -> 300], VertexStyle -> Red]](https://www.wolframcloud.com/obj/resourcesystem/images/fb0/fb0390ad-0129-4cc4-a61e-ff743b54eabb/33d56da63991afe8.png)

![ResourceData[\!\(\*
TagBox["\"\<North American Airline Reachability Network\>\"",
#& ,
BoxID -> "ResourceTag-North American Airline Reachability Network-Input",
AutoDelete->True]\), "Node name"][[#]] & /@ EdgeList[ResourceData[\!\(\*
TagBox["\"\<North American Airline Reachability Network\>\"",
#& ,
BoxID -> "ResourceTag-North American Airline Reachability Network-Input",
AutoDelete->True]\)]][[PositionSmallest[distance], 1]]](https://www.wolframcloud.com/obj/resourcesystem/images/fb0/fb0390ad-0129-4cc4-a61e-ff743b54eabb/05c2809057254728.png)
![GraphPlot[ResourceData[\!\(\*
TagBox["\"\<North American Airline Reachability Network\>\"",
#& ,
BoxID -> "ResourceTag-North American Airline Reachability Network-Input",
AutoDelete->True]\)], VertexCoordinates -> Thread[Range[
Length[
ResourceData[
ResourceObject[
EvaluationNotebook[]], "Position"]]] -> ResourceData[\!\(\*
TagBox["\"\<North American Airline Reachability Network\>\"",
#& ,
BoxID -> "ResourceTag-North American Airline Reachability Network-Input",
AutoDelete->True]\), "Position"]], EdgeStyle -> Directive[Thin,
Opacity[0.05]], VertexSize -> Thread[EdgeList[ResourceData[\!\(\*
TagBox["\"\<North American Airline Reachability Network\>\"",
#& ,
BoxID -> "ResourceTag-North American Airline Reachability Network-Input",
AutoDelete->True]\)]][[PositionSmallest[distance], 1]] -> 300], VertexStyle -> Red]](https://www.wolframcloud.com/obj/resourcesystem/images/fb0/fb0390ad-0129-4cc4-a61e-ff743b54eabb/3552b987f013e6d0.png)
![communities = FindGraphCommunities[ResourceData[\!\(\*
TagBox["\"\<North American Airline Reachability Network\>\"",
#& ,
BoxID -> "ResourceTag-North American Airline Reachability Network-Input",
AutoDelete->True]\)]];](https://www.wolframcloud.com/obj/resourcesystem/images/fb0/fb0390ad-0129-4cc4-a61e-ff743b54eabb/1680c696bd29977b.png)
![GraphPlot[ResourceData[\!\(\*
TagBox["\"\<North American Airline Reachability Network\>\"",
#& ,
BoxID -> "ResourceTag-North American Airline Reachability Network-Input",
AutoDelete->True]\)], VertexCoordinates -> Thread[Range[
Length[
ResourceData[
ResourceObject[
EvaluationNotebook[]], "Position"]]] -> ResourceData[\!\(\*
TagBox["\"\<North American Airline Reachability Network\>\"",
#& ,
BoxID -> "ResourceTag-North American Airline Reachability Network-Input",
AutoDelete->True]\), "Position"]], Sequence[
EdgeStyle -> Directive[Thin,
Opacity[0.05]], VertexSize -> 50], VertexStyle -> Flatten[(Thread[#] & /@ Thread[communities -> (
Map[
ColorData[114],
Range[
Length[communities]]])]), 1]]](https://www.wolframcloud.com/obj/resourcesystem/images/fb0/fb0390ad-0129-4cc4-a61e-ff743b54eabb/37fc0c6be506e535.png)