Basic Examples
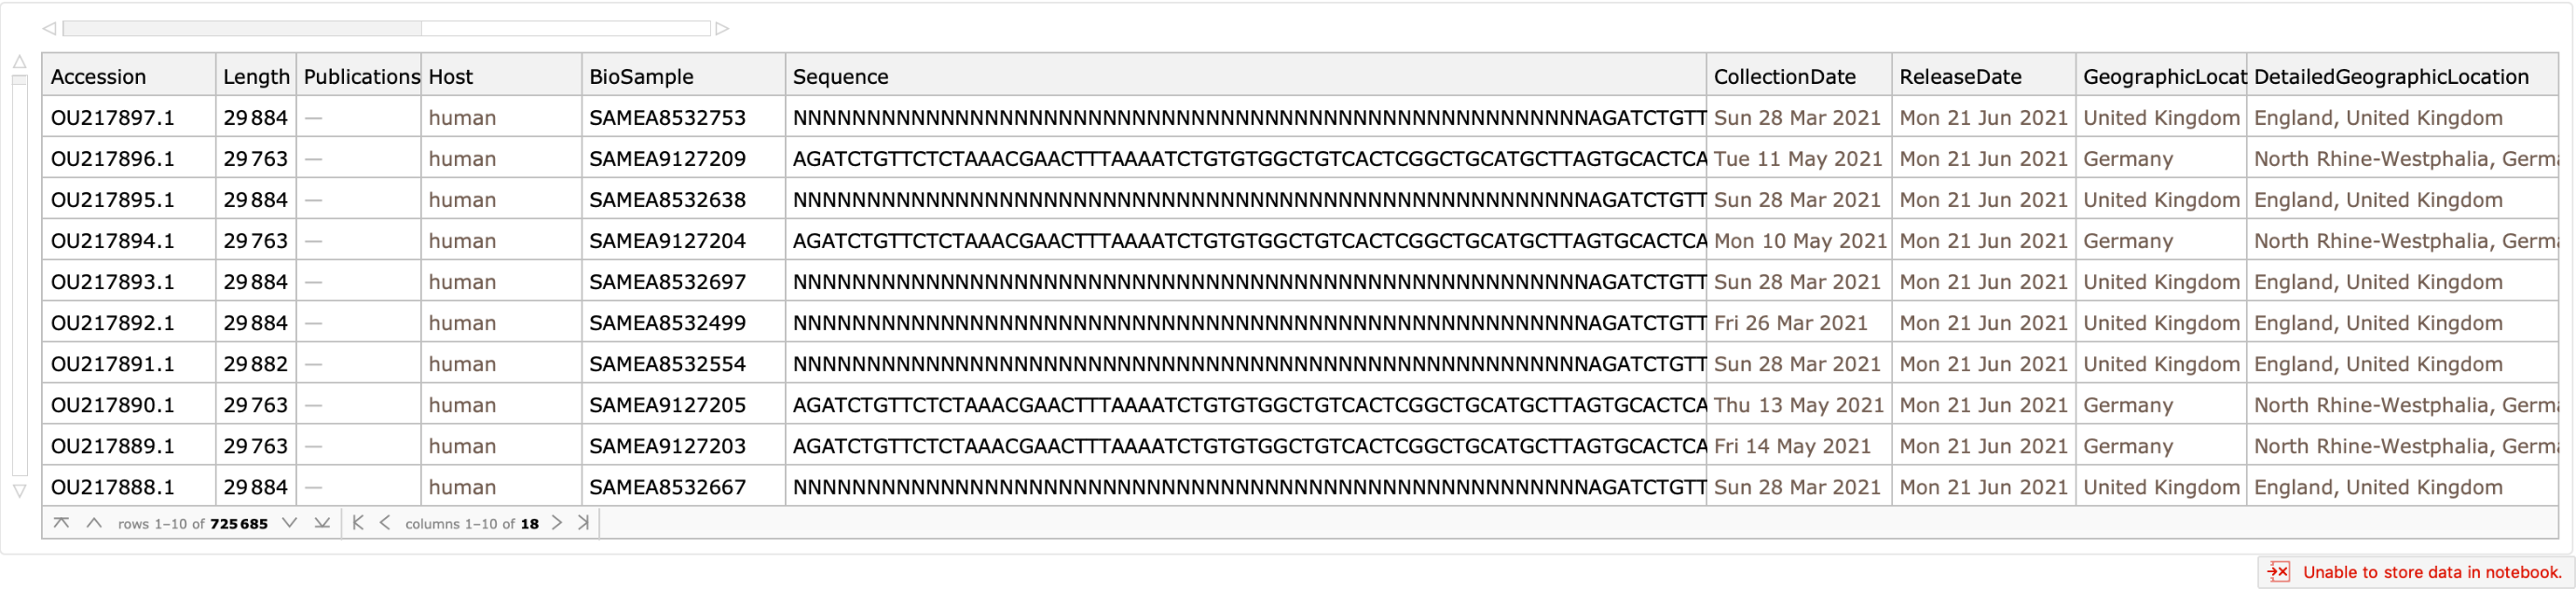
Get a Dataset containing rows for the most recent sequences:
Get a Dataset containing rows for all sequences (this can take considerable time to download and expand):
Return the latest date a sequence was released:
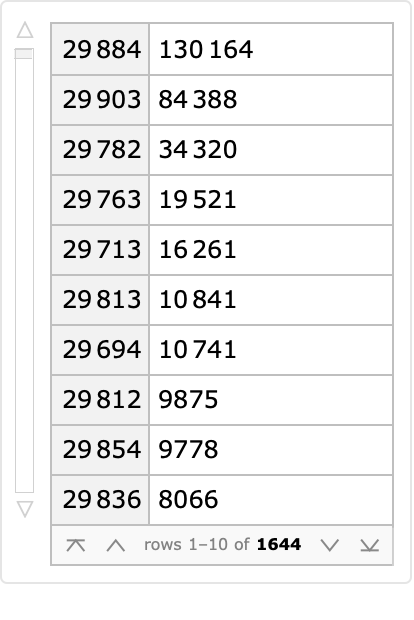
Count the different lengths of sequences provided, which corresponds well to the part of the virus that was sequenced:
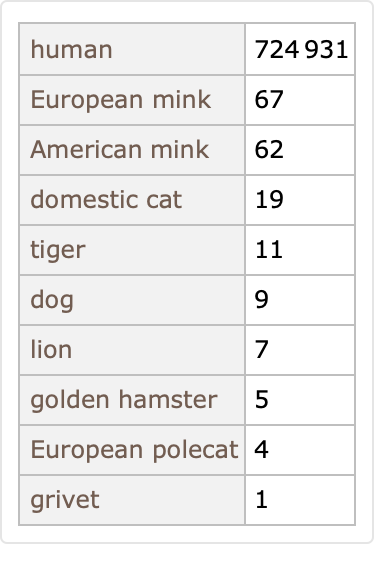
Most of these SARS-CoV-2 samples are collected from humans, but not all:
Some of these genetic sequences correspond to named variations of interest as designated by the World Health Organization (WHO):
Scope & Additional Elements
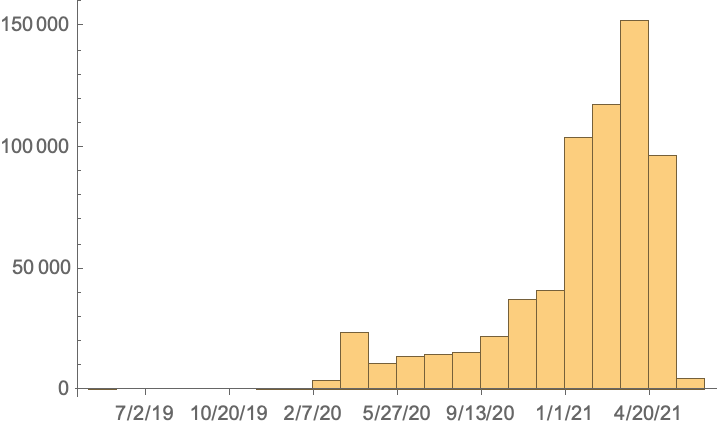
Get a date histogram of collection dates:
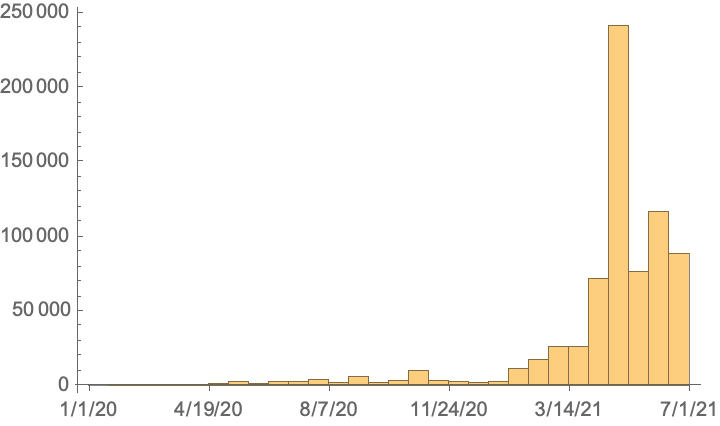
See a date histogram of release dates:
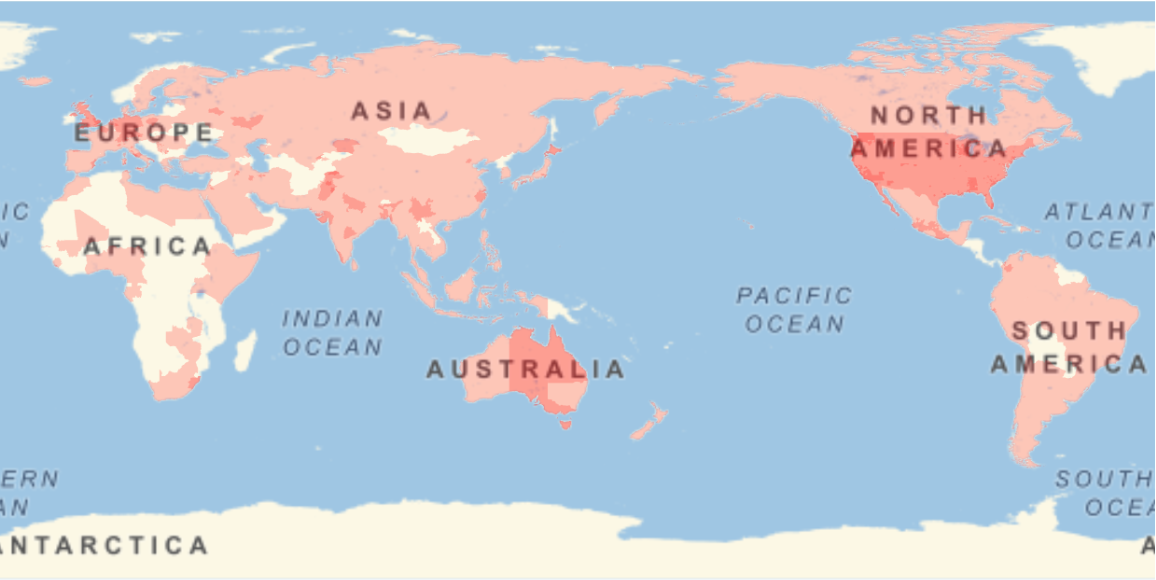
Show the locations where the sequences were gathered:
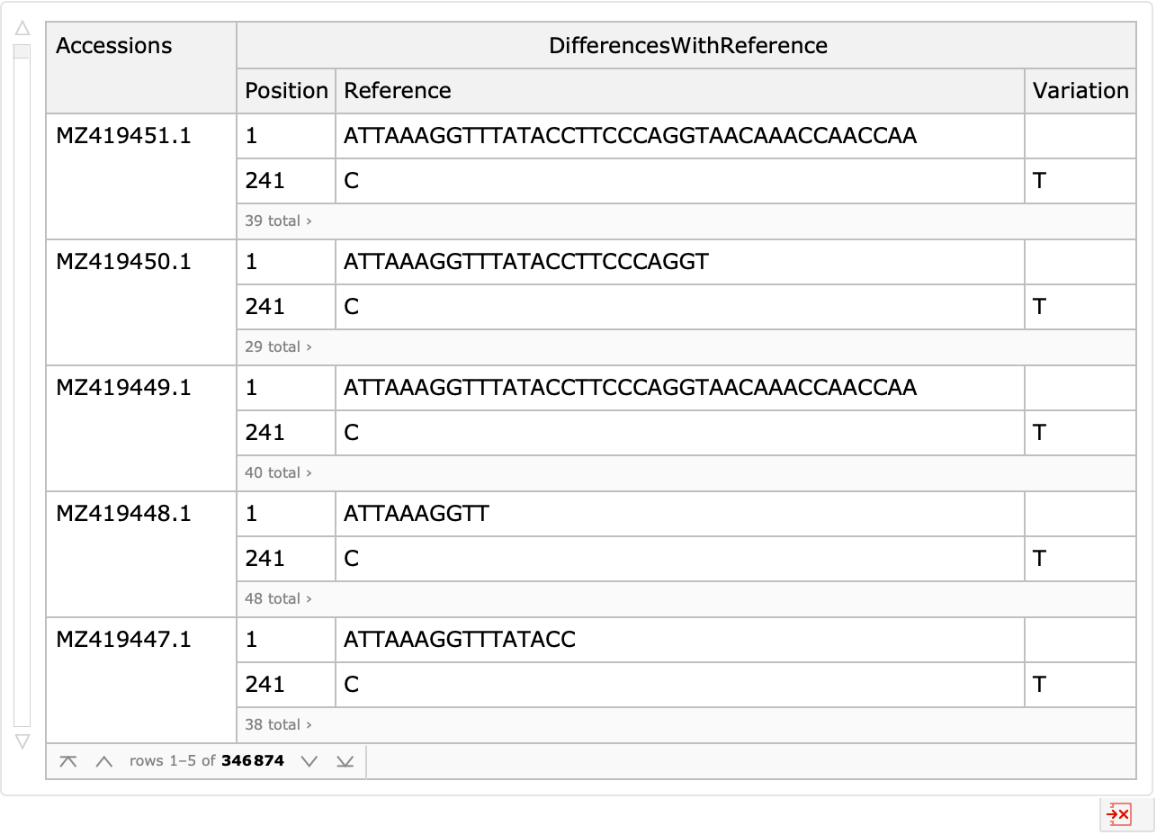
Obtain the available alignment differences with the reference sequence:
Show the authors with the accessions of the sequences they submitted:
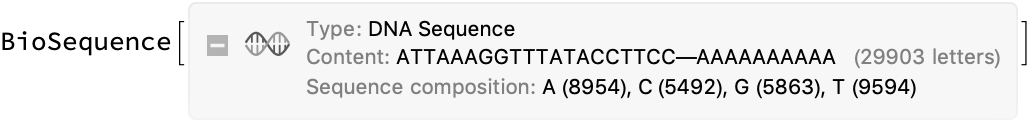
Obtain the reference sequence as a biomolecular sequence:
Visualizations
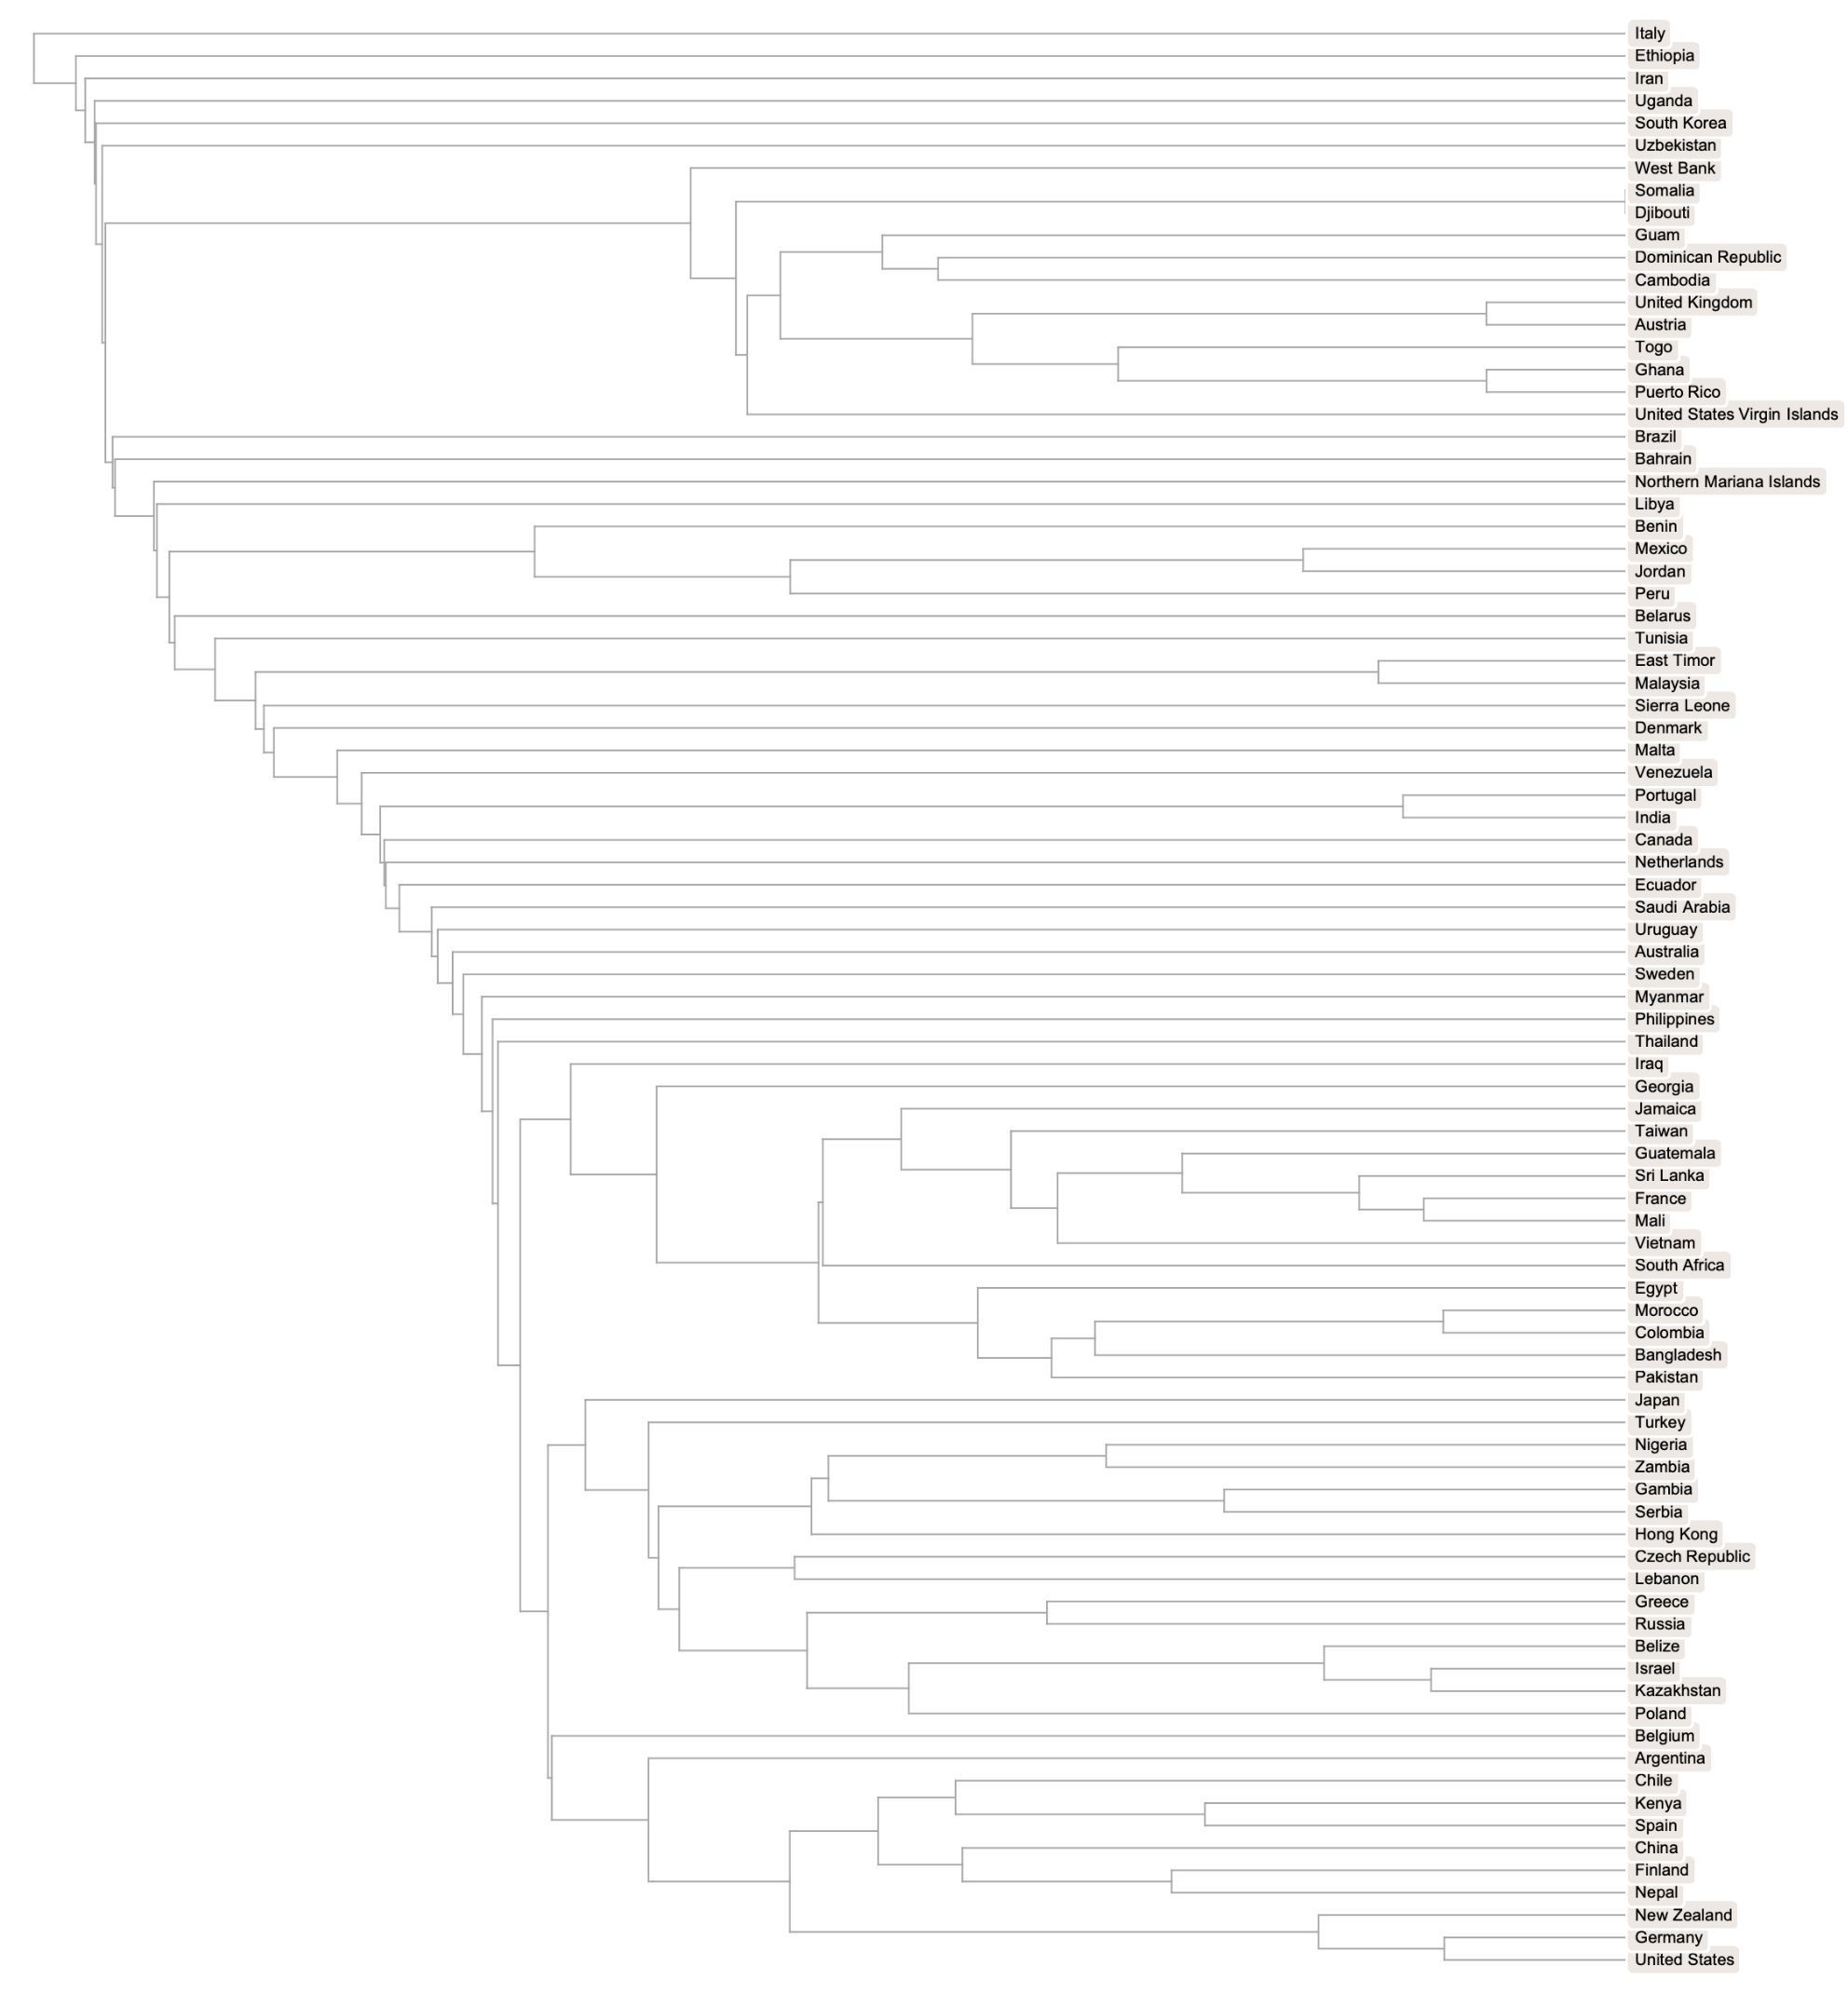
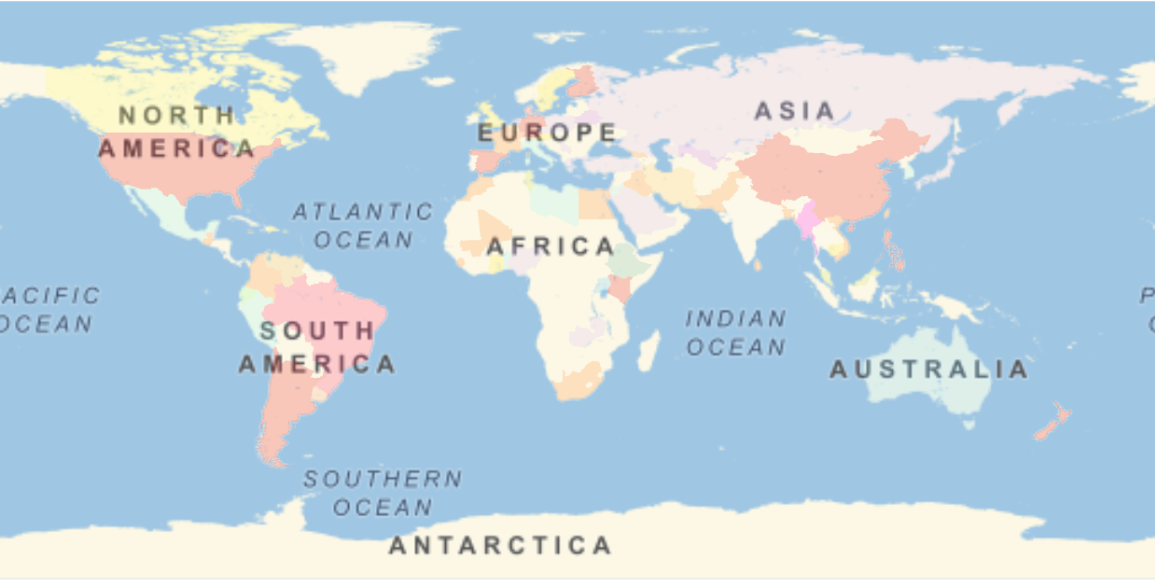
A phylogenetic tree comparison of the most-common complete genomes by location shows clusters that are broadly distributed. Dropping the trailing sequences of adenine terms avoids arbitrary differences from varying poly(A) RNA tail lengths, which may be sequencing artifacts and shouldn’t affect viral adaptivity:
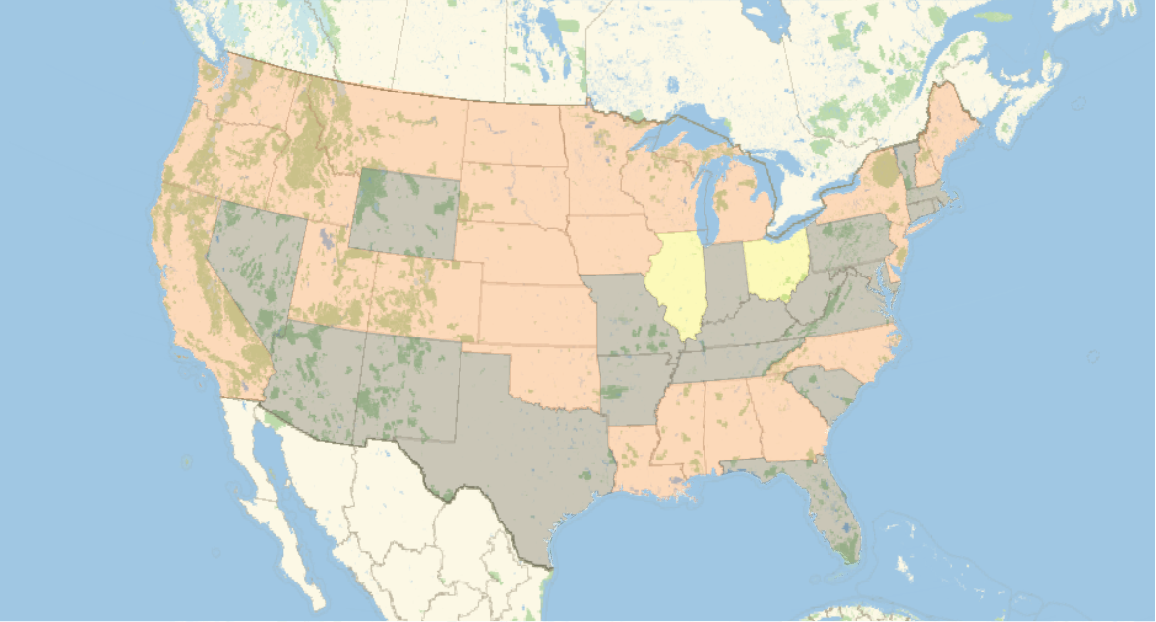
A similar visualization can be created for samples where more detailed geographic information is supplied. In this visualization of most-common sequences reported for US states, we see the emergence of clusters containing interesting regional blocks as shown in the map below:
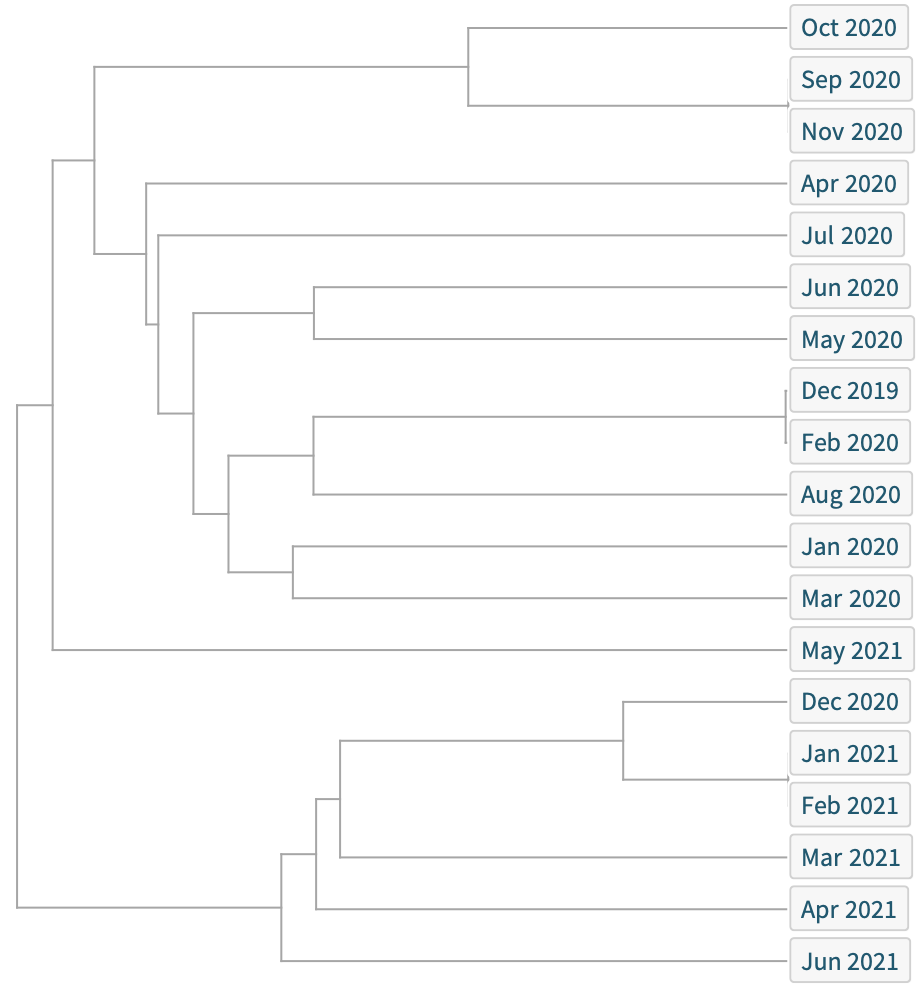
When visualizing the similarity of the most common sequence by month of sequence collection, there are recurring overlaps (most significantly between December 2019 and February 2020), illustrating that the virus has not only seen evolution, but significant continuity. Since then, greater spread has led to further divergence:
Analysis
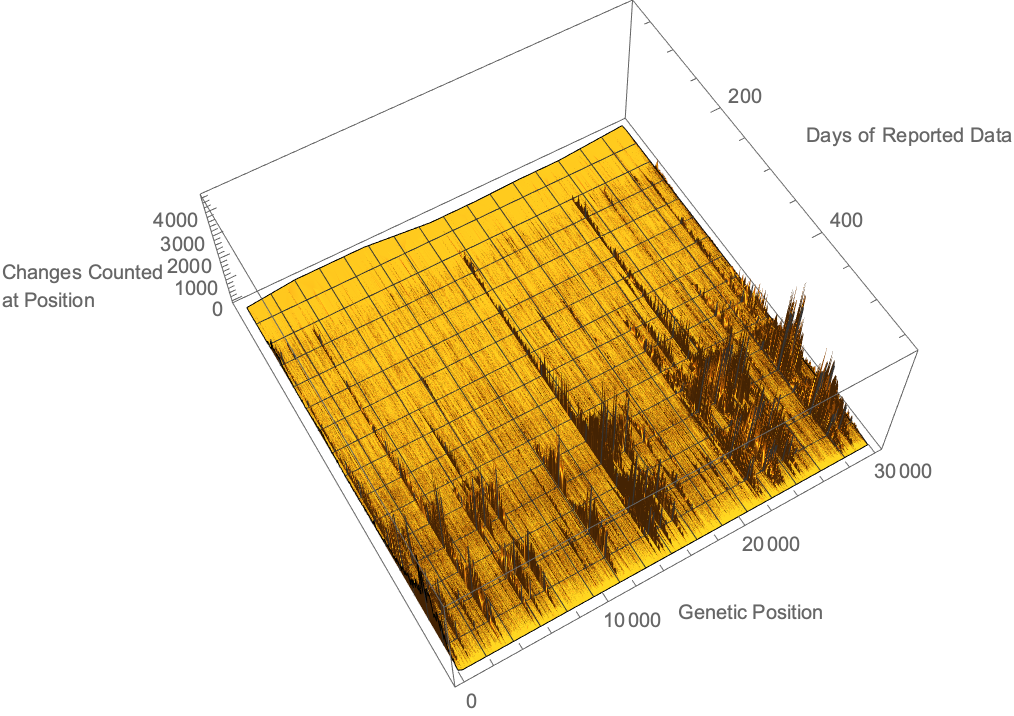
Using the provided alignment differences, we can see where along the viral genome changes have been detected over time. We see that while mutations are relatively uniformly distributed, there are certainly changes more commonly measured than others:
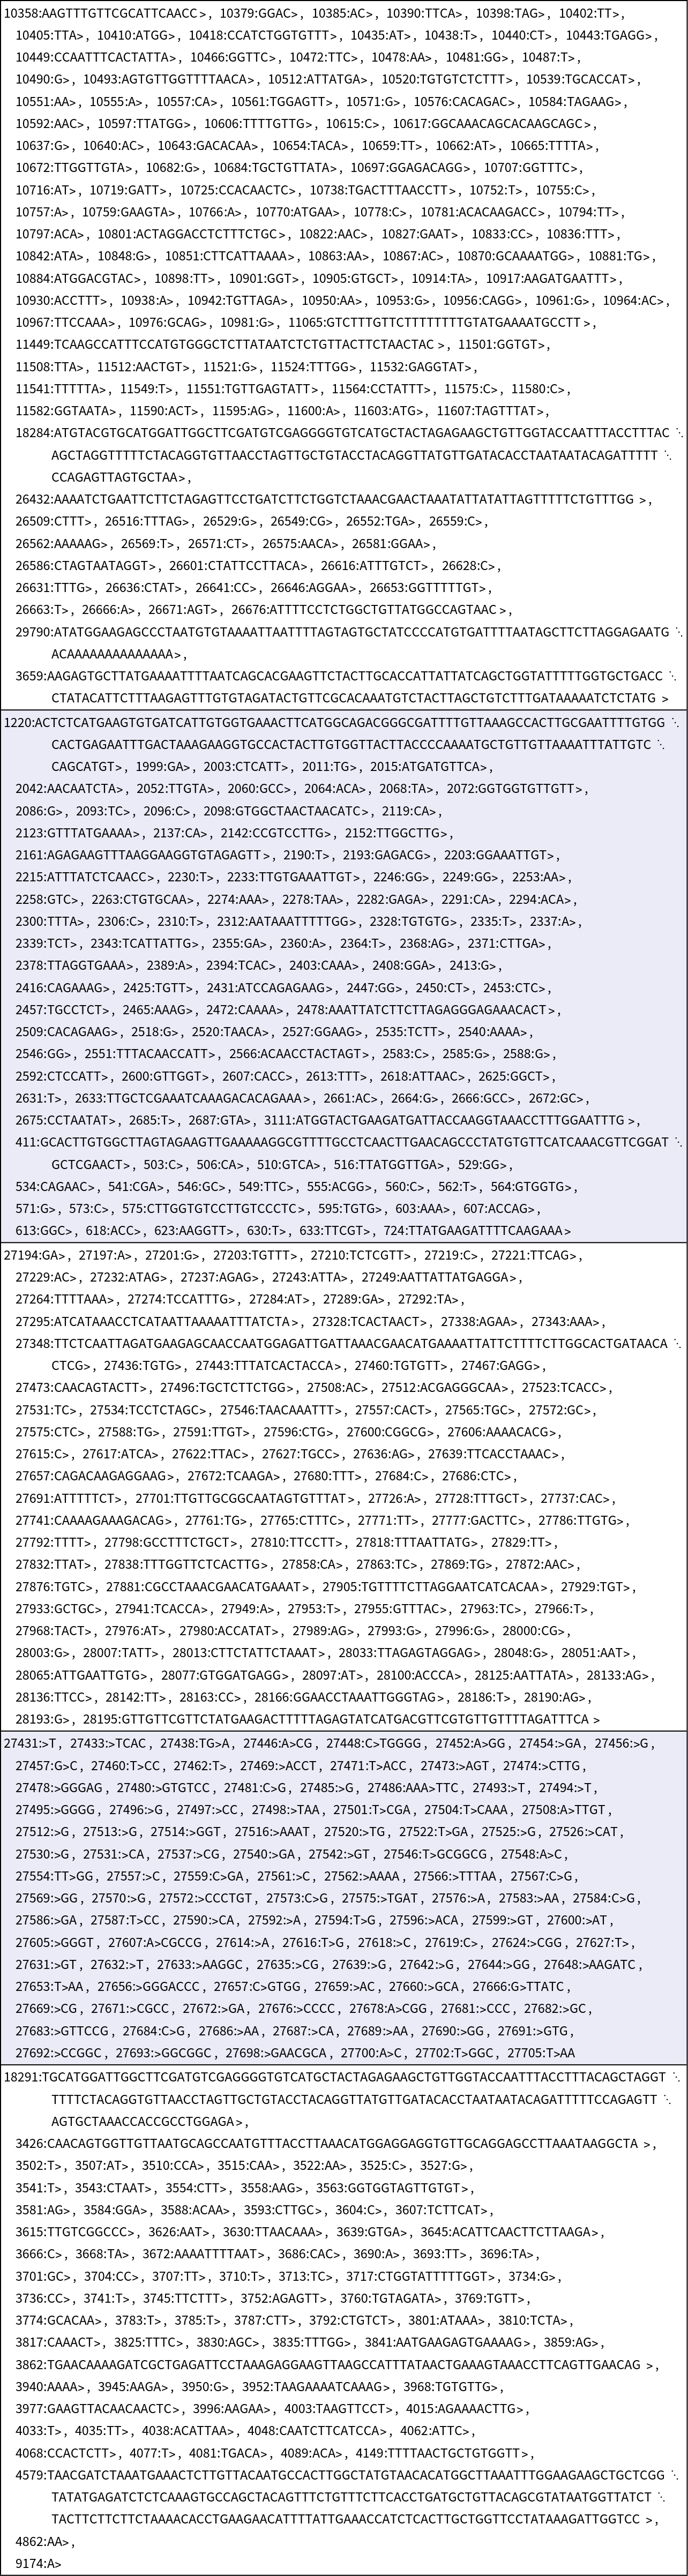
It is also possible to treat these genetic differences as lists of features:
By doing so, it is possible to perform a fairly wide variety of analysis. Here, we determine all of the genetic differences that always occur together in the sampled sequences, taking advantage of the fact that when differences always occur together they must occur in the same number of sequences:

![ReverseSort[
ResourceData["Genetic Sequences for the SARS-CoV-2 Coronavirus"][
Select[Not[MissingQ[#Host]] &]][Counts, "Host"]]](https://www.wolframcloud.com/obj/resourcesystem/images/873/8738b472-f1d1-462b-ac34-e9684a4dc088/05196110108a8971.png)
![ReverseSort[
ResourceData["Genetic Sequences for the SARS-CoV-2 Coronavirus"][
Select[Not[MissingQ[#WHONamedVariant]] &]][Counts, "WHONamedVariant"]]](https://www.wolframcloud.com/obj/resourcesystem/images/873/8738b472-f1d1-462b-ac34-e9684a4dc088/7efa7ac02763d222.png)


![dropTrailingA[seq_] := StringReplace[seq, StartOfString ~~ Shortest[a__] ~~ ("A" ..) ~~ EndOfString :> a];
sampleListFirstByMostCommon[lists : {___List}] := DeleteCases[
Prepend[#[[1, 2 ;; -1]], ReverseSortBy[Tally[First /@ #], Last][[1, 1]]] & /@ GatherBy[lists, Rest], {_, _Missing}];
treePlot = Apply[ResourceFunction["PhylogeneticTreePlot"], Transpose[{dropTrailingA@First[#], Row@(Rest@#)} & /@ sampleListFirstByMostCommon[{#[[1]], #[[2]]} &@*Values /@ Normal[ResourceData[
"Genetic Sequences for the SARS-CoV-2 Coronavirus"][
Select[And[
StringContainsQ[#GenBankTitle, "complete genome"], #Host ===
Entity["Species", "Species:HomoSapiens"]] &], {"Sequence",
"GeographicLocation"}]]]]
]](https://www.wolframcloud.com/obj/resourcesystem/images/873/8738b472-f1d1-462b-ac34-e9684a4dc088/2dada4daecc0ccb1.png)
![GeoGraphics[{MapIndexed[
Splice[{ColorData[60][#2[[1]]], Splice[Polygon /@ #1]}] &,
{{
Entity["Country", "Argentina"],
Entity["Country", "China"],
Entity["Country", "Chile"],
Entity["Country", "Finland"],
Entity["Country", "Germany"],
Entity["Country", "Kenya"],
Entity["Country", "Nepal"],
Entity["Country", "NewZealand"],
Entity["Country", "Spain"],
Entity["Country", "UnitedStates"]}, {
Entity["Country", "Belize"],
Entity["Country", "CzechRepublic"],
Entity["Country", "Gambia"],
Entity["Country", "Greece"],
Entity["Country", "HongKong"],
Entity["Country", "Israel"],
Entity["Country", "Japan"],
Entity["Country", "Kazakhstan"],
Entity["Country", "Lebanon"],
Entity["Country", "Nigeria"],
Entity["Country", "Poland"],
Entity["Country", "Russia"],
Entity["Country", "Serbia"],
Entity["Country", "Turkey"],
Entity["Country", "Zambia"]}, {
Entity["Country", "Bangladesh"],
Entity["Country", "Colombia"],
Entity["Country", "Egypt"],
Entity["Country", "France"],
Entity["Country", "Georgia"],
Entity["Country", "Guatemala"],
Entity["Country", "Iraq"],
Entity["Country", "Jamaica"],
Entity["Country", "Mali"],
Entity["Country", "Morocco"],
Entity["Country", "Pakistan"],
Entity["Country", "SouthAfrica"],
Entity["Country", "SriLanka"],
Entity["Country", "Taiwan"],
Entity["Country", "Vietnam"]}, {
Entity["Country", "Benin"],
Entity["Country", "Italy"],
Entity["Country", "Jordan"],
Entity["Country", "Libya"],
Entity["Country", "Mexico"],
Entity["Country", "Peru"]}, {
Entity["Country", "Austria"],
Entity["Country", "Cambodia"],
Entity["Country", "DominicanRepublic"],
Entity["Country", "Ghana"],
Entity["Country", "Guam"],
Entity["Country", "PuertoRico"],
Entity["Country", "Togo"],
Entity["Country", "UnitedKingdom"],
Entity["Country", "UnitedStatesVirginIslands"],
Entity["Country", "WestBank"]}, {
Entity["Country", "India"],
Entity["Country", "Portugal"]},
{
Entity["Country", "EastTimor"],
Entity["Country", "Malaysia"]}, Splice[List /@ {
Entity["Country", "Australia"],
Entity["Country", "Bahrain"],
Entity["Country", "Belarus"],
Entity["Country", "Belgium"],
Entity["Country", "Brazil"],
Entity["Country", "Canada"],
Entity["Country", "Denmark"],
Entity["Country", "Ecuador"],
Entity["Country", "Ethiopia"],
Entity["Country", "Iran"],
Entity["Country", "Malta"],
Entity["Country", "Myanmar"],
Entity["Country", "Netherlands"],
Entity["Country", "NorthernMarianaIslands"],
Entity["Country", "Philippines"],
Entity["Country", "SaudiArabia"],
Entity["Country", "SierraLeone"],
Entity["Country", "SouthKorea"],
Entity["Country", "Sweden"],
Entity["Country", "Thailand"],
Entity["Country", "Tunisia"],
Entity["Country", "Uganda"],
Entity["Country", "Uruguay"],
Entity["Country", "Uzbekistan"],
Entity["Country", "Venezuela"]}]}]}]](https://www.wolframcloud.com/obj/resourcesystem/images/873/8738b472-f1d1-462b-ac34-e9684a4dc088/66257153e3132255.png)
![Apply[ResourceFunction["PhylogeneticTreePlot"], Transpose[{dropTrailingA@First[#], Last[#]} & /@ sampleListFirstByMostCommon[{#[[1]], #[[2]]} &@*Values /@ Normal[ResourceData[
"Genetic Sequences for the SARS-CoV-2 Coronavirus"][
Select[And[
StringContainsQ[#GenBankTitle, "complete genome"], #Host ===
Entity["Species", "Species:HomoSapiens"],
Not[MissingQ[#USState]]] &], {"Sequence", "USState"}]]]]
]](https://www.wolframcloud.com/obj/resourcesystem/images/873/8738b472-f1d1-462b-ac34-e9684a4dc088/2a08eff048a21cb3.png)

![GeoGraphics[{MapIndexed[
Splice[{ColorData[3][#2[[1]]], Splice[Polygon /@ #1]}] &, {{
Entity["AdministrativeDivision", {"Arizona", "UnitedStates"}],
Entity["AdministrativeDivision", {"Arkansas", "UnitedStates"}],
Entity["AdministrativeDivision", {"Connecticut", "UnitedStates"}],
Entity["AdministrativeDivision", {"Florida", "UnitedStates"}],
Entity["AdministrativeDivision", {"Indiana", "UnitedStates"}],
Entity["AdministrativeDivision", {"Kentucky", "UnitedStates"}],
Entity["AdministrativeDivision", {"Maryland", "UnitedStates"}],
Entity["AdministrativeDivision", {"Massachusetts", "UnitedStates"}],
Entity["AdministrativeDivision", {"Missouri", "UnitedStates"}],
Entity["AdministrativeDivision", {"Nevada", "UnitedStates"}],
Entity["AdministrativeDivision", {"NewMexico", "UnitedStates"}],
Entity["AdministrativeDivision", {"Pennsylvania", "UnitedStates"}],
Entity["AdministrativeDivision", {"RhodeIsland", "UnitedStates"}],
Entity["AdministrativeDivision", {"SouthCarolina", "UnitedStates"}],
Entity["AdministrativeDivision", {"Tennessee", "UnitedStates"}],
Entity["AdministrativeDivision", {"Texas", "UnitedStates"}],
Entity["AdministrativeDivision", {"Virginia", "UnitedStates"}],
Entity["AdministrativeDivision", {"WestVirginia", "UnitedStates"}],
Entity["AdministrativeDivision", {"Vermont", "UnitedStates"}],
Entity["AdministrativeDivision", {"Wyoming", "UnitedStates"}]}, {
Entity["AdministrativeDivision", {"Alabama", "UnitedStates"}],
Entity["AdministrativeDivision", {"California", "UnitedStates"}],
Entity["AdministrativeDivision", {"Colorado", "UnitedStates"}],
Entity["AdministrativeDivision", {"Delaware", "UnitedStates"}],
Entity["AdministrativeDivision", {"DistrictOfColumbia", "UnitedStates"}],
Entity["AdministrativeDivision", {"Georgia", "UnitedStates"}],
Entity["AdministrativeDivision", {"Idaho", "UnitedStates"}],
Entity["AdministrativeDivision", {"Iowa", "UnitedStates"}],
Entity["AdministrativeDivision", {"Kansas", "UnitedStates"}],
Entity["AdministrativeDivision", {"Louisiana", "UnitedStates"}],
Entity["AdministrativeDivision", {"Maine", "UnitedStates"}],
Entity["AdministrativeDivision", {"Michigan", "UnitedStates"}],
Entity["AdministrativeDivision", {"Minnesota", "UnitedStates"}],
Entity["AdministrativeDivision", {"Mississippi", "UnitedStates"}],
Entity["AdministrativeDivision", {"Montana", "UnitedStates"}],
Entity["AdministrativeDivision", {"Nebraska", "UnitedStates"}],
Entity["AdministrativeDivision", {"NewHampshire", "UnitedStates"}],
Entity["AdministrativeDivision", {"NewJersey", "UnitedStates"}],
Entity["AdministrativeDivision", {"NewYork", "UnitedStates"}],
Entity["AdministrativeDivision", {"NorthCarolina", "UnitedStates"}],
Entity["AdministrativeDivision", {"NorthDakota", "UnitedStates"}],
Entity["AdministrativeDivision", {"Oklahoma", "UnitedStates"}],
Entity["AdministrativeDivision", {"Oregon", "UnitedStates"}],
Entity["AdministrativeDivision", {"SouthDakota", "UnitedStates"}],
Entity["AdministrativeDivision", {"Utah", "UnitedStates"}],
Entity["AdministrativeDivision", {"Washington", "UnitedStates"}],
Entity["AdministrativeDivision", {"Wisconsin", "UnitedStates"}]}, {
Entity["AdministrativeDivision", {"Illinois", "UnitedStates"}],
Entity["AdministrativeDivision", {"Ohio", "UnitedStates"}]}, Splice[List /@ {}]}]}]](https://www.wolframcloud.com/obj/resourcesystem/images/873/8738b472-f1d1-462b-ac34-e9684a4dc088/6da18d7d891e7aa3.png)
![sampleListFirstByMostCommon[lists : {___List}] := DeleteCases[
Prepend[#[[1, 2 ;; -1]], ReverseSortBy[Tally[First /@ #], Last][[1, 1]]] & /@ GatherBy[lists, Rest], {_, DateObject[_Missing, "Month"]}];
treePlot = Apply[ResourceFunction["PhylogeneticTreePlot"], Transpose[{dropTrailingA@First[#], Row@(Rest@#)} & /@ sampleListFirstByMostCommon[{#[[1]], DateObject[#[[2]], "Month"]} &@*Values /@ Normal[ResourceData[
"Genetic Sequences for the SARS-CoV-2 Coronavirus"][
Select[And[
StringContainsQ[#GenBankTitle, "complete genome"], #Host ===
Entity["Species", "Species:HomoSapiens"]] &], {"Sequence",
"CollectionDate"}]]]]
]](https://www.wolframcloud.com/obj/resourcesystem/images/873/8738b472-f1d1-462b-ac34-e9684a4dc088/5f2e3d989ba6dd5c.png)
![minDate = ResourceData["Genetic Sequences for the SARS-CoV-2 Coronavirus"][
Select[StringContainsQ[#GenBankTitle, "complete genome"] &]][Min, "CollectionDate"];
accessionToDiffList = <|
Rule @@@ Normal[Values /@ ResourceData["Genetic Sequences for the SARS-CoV-2 Coronavirus",
"AlignmentDifferences"]]|>;
positionCountPerCollectionDay = Sort[Flatten[
With[{day = #[[1, 1]]}, Prepend[#, day] & /@ Tally[Flatten[Last /@ #]]] & /@ GatherBy[{Ceiling[
QuantityMagnitude[
DateDifference[minDate, #[[1]]]]], (#["Position"]) & /@ accessionToDiffList[#[[2]]]} & /@ Normal[Values /@ ResourceData[
"Genetic Sequences for the SARS-CoV-2 Coronavirus"][
Select[And[Not[MissingQ[#CollectionDate]], KeyExistsQ[accessionToDiffList, #Accession]] &]
][[All, {"CollectionDate", "Accession"}]]],
First], 1]];
ListPlot3D[positionCountPerCollectionDay,
AxesLabel -> {"Days of Reported Data", "Genetic Position", "Changes Counted\nat Position"}, PlotRange -> All
]](https://www.wolframcloud.com/obj/resourcesystem/images/873/8738b472-f1d1-462b-ac34-e9684a4dc088/528a86975dfa3f21.png)
![diffToStringFeature[diff_Association] := ToString[diff["Position"]] <> ":" <> diff["Reference"] <> ">" <> diff["Variation"];
diffToStringFeature[diffs : {___Association}] := Map[diffToStringFeature, diffs];
accessionToFeatureList = diffToStringFeature /@ accessionToDiffList;
accessionToFeatureList // Keys // First // accessionToFeatureList](https://www.wolframcloud.com/obj/resourcesystem/images/873/8738b472-f1d1-462b-ac34-e9684a4dc088/4d0b79c6a1ed6853.png)

![featureIndex = <|
Rule[#[[1, 1]], Last /@ #] & /@ GatherBy[
Flatten[Function[{diffList}, {#, diffList} & /@ diffList] /@ Values[accessionToFeatureList], 1], First]|>;
termCountIndex = <|
Rule[#[[1, 1]], Last /@ #] & /@ GatherBy[{Length[featureIndex[#]], #} & /@ Keys[featureIndex], First]|>;
doesAlwaysCoOccur[firstTerm_, secondTerm_] := AllTrue[featureIndex[firstTerm], MemberQ[#, secondTerm] &];
findCoOccurPairs[terms_List] := Module[{firstTermResults, remainingTerms = terms, firstTerm, restTerms},
Flatten[Reap[While[remainingTerms =!= {},
firstTerm = First[remainingTerms];
restTerms = Rest[remainingTerms];
firstTermResults = Rule[firstTerm, #] & /@ Select[restTerms, doesAlwaysCoOccur[firstTerm, #] &];
Sow[firstTermResults];
remainingTerms = Complement[restTerms, Last /@ firstTermResults];
]][[2, 1]], 1]
]
coOccurenceSets =
WeaklyConnectedComponents[
Flatten[findCoOccurPairs[termCountIndex[#]] & /@ Keys[termCountIndex], 1]];
ResourceFunction["NiceGrid"][
Row[Sort[#], ", "] & /@ Take[coOccurenceSets, 5], Alignment -> Left]](https://www.wolframcloud.com/obj/resourcesystem/images/873/8738b472-f1d1-462b-ac34-e9684a4dc088/5ccdfbd25e6b109b.png)