Wolfram Data Repository
Immediate Computable Access to Curated Contributed Data
Estimated cases of novel coronavirus (COVID-19, formerly known as 2019-nCoV) infection by country or region (This data was imported and made computable on January 31, 2022)
Retrieve the default content:
| In[1]:= |
| Out[1]= | 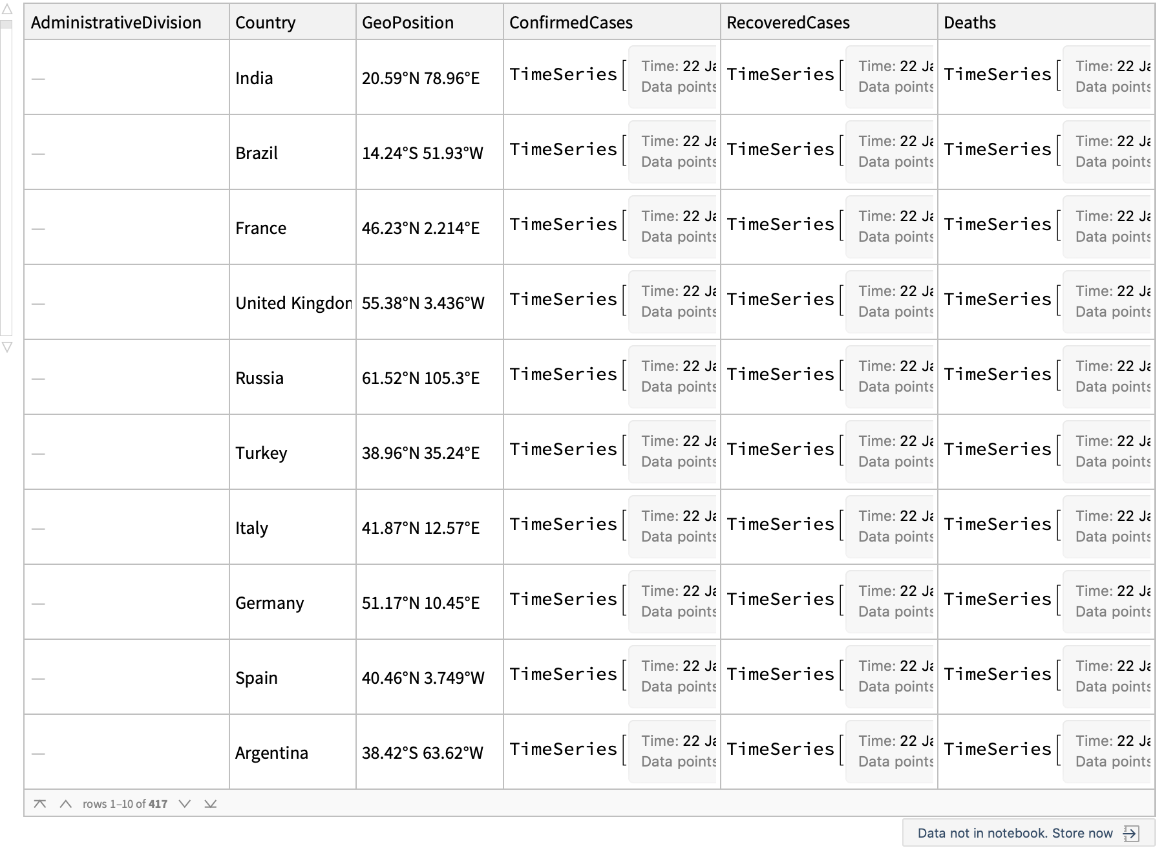 |
Latest update date:
| In[2]:= |
| Out[2]= |
Retrieve the data for five most affected countries:
| In[3]:= | ![ResourceData[\!\(\*
TagBox["\"\<Epidemic Data for Novel Coronavirus COVID-19\>\"",
#& ,
BoxID -> "ResourceTag-Epidemic Data for Novel Coronavirus COVID-19-Input",
AutoDelete->True]\), "WorldCountries"][
TakeLargestBy[#ConfirmedCases["LastValue"] &, 5], {"Country", "ConfirmedCases", "RecoveredCases", "Deaths"}]](https://www.wolframcloud.com/obj/resourcesystem/images/dba/dba89a96-2b3a-4254-8824-cb1f9e01a94b/563e3afb4765ad0e.png) |
| Out[3]= | 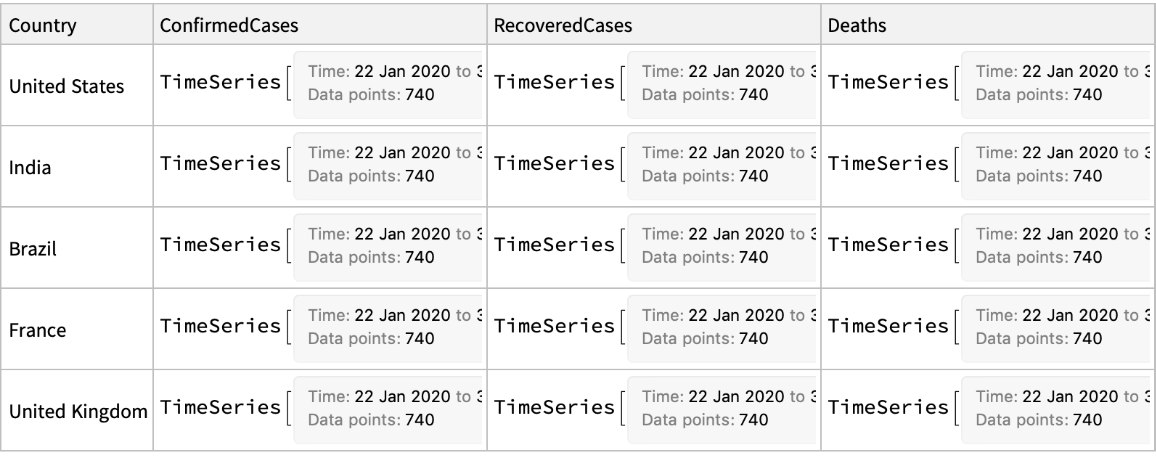 |
Plot estimated confirmed cases by country over the past few months:
| In[4]:= | ![DateListLogPlot[
Callout[Tooltip[10^5 #2/#1["Population"], CommonName[#1]], #1] & @@@ Normal@ResourceData[\!\(\*
TagBox["\"\<Epidemic Data for Novel Coronavirus COVID-19\>\"",
#& ,
BoxID -> "ResourceTag-Epidemic Data for Novel Coronavirus COVID-19-Input",
AutoDelete->True]\), "WorldCountries"][
TakeLargestBy[#ConfirmedCases["LastValue"] &, 30]][
All, {#Country, #ConfirmedCases} &], Sequence[
PlotRange -> All, GridLines -> Automatic, AspectRatio -> 1.5, ImageSize -> 500, PlotLabel -> "estimated confirmed cases per 100K people (log scale)"]]](https://www.wolframcloud.com/obj/resourcesystem/images/dba/dba89a96-2b3a-4254-8824-cb1f9e01a94b/102e3afc8bd763bf.png) |
| Out[4]= | 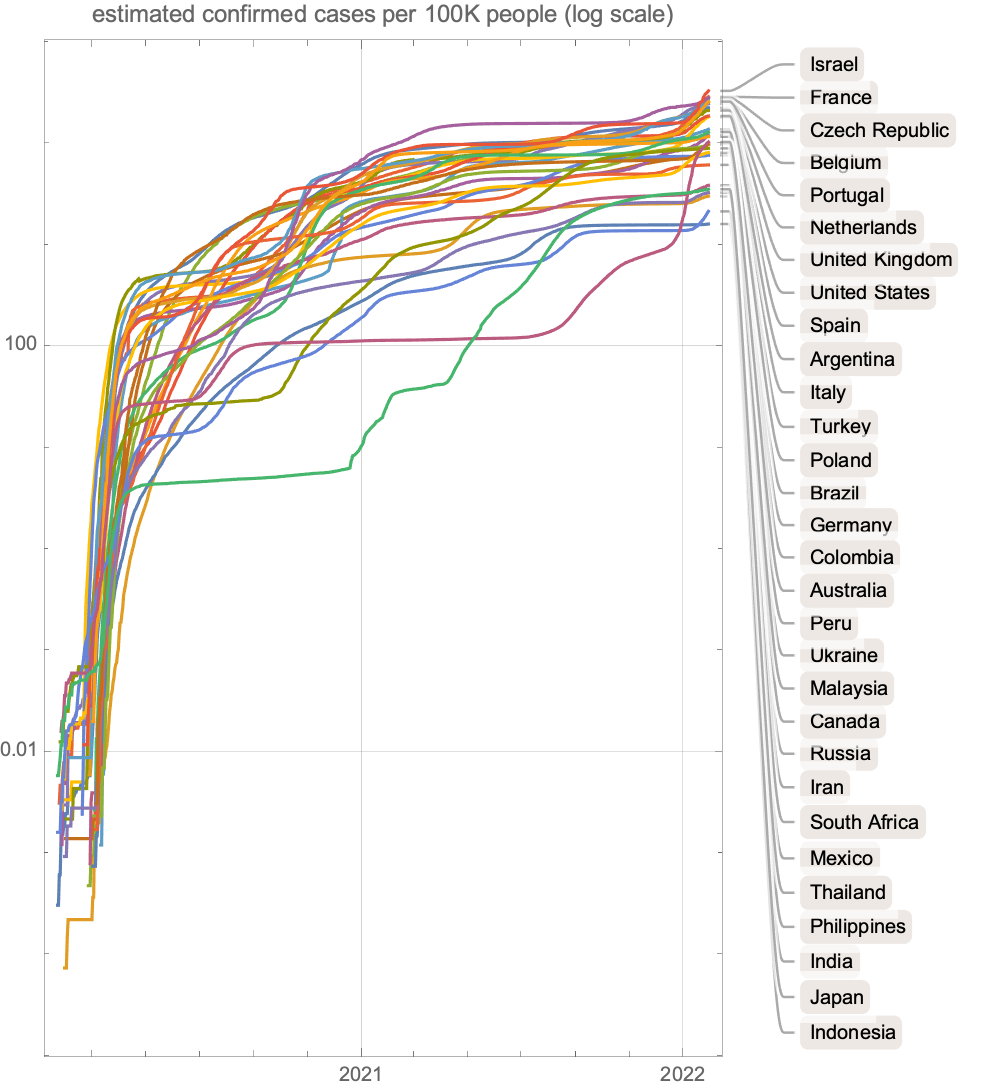 |
Color countries by the latest confirmed cases:
| In[5]:= |
| Out[5]= | 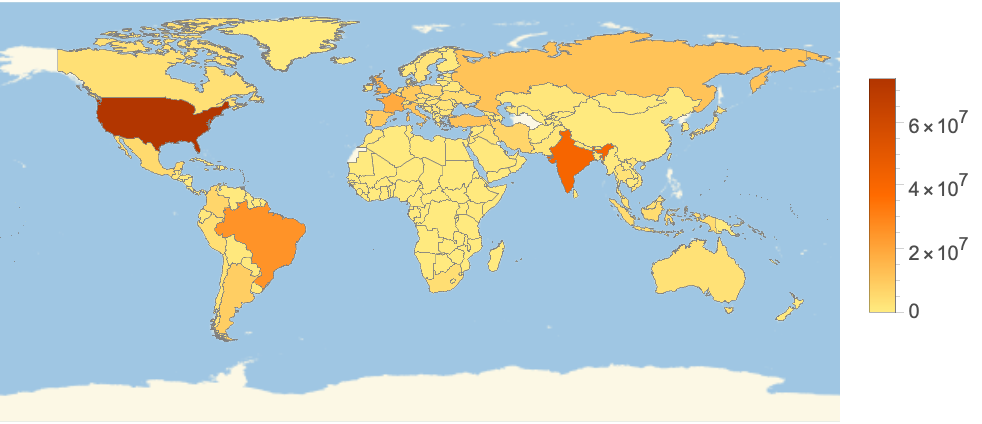 |
Visualize the trend of new cases in twenty most affected countries:
| In[6]:= | ![ResourceData[\!\(\*
TagBox["\"\<Epidemic Data for Novel Coronavirus COVID-19\>\"",
#& ,
BoxID -> "ResourceTag-Epidemic Data for Novel Coronavirus COVID-19-Input",
AutoDelete->True]\), "WorldCountries"][
TakeLargestBy[#ConfirmedCases["LastValue"] &, 20]][
SortBy[FindPeaks[
MovingAverage[Differences[#ConfirmedCases], Quantity[4, "Weeks"]], 10]["DatePath"][[1, 1]] &]][
All, #Country -> Rescale[TimeSeries[
MovingAverage[Differences[#ConfirmedCases], Quantity[1, "Weeks"]], MissingDataMethod -> Automatic][
"Values"]] &] // Normal // Association // MatrixPlot[Values[#], FrameTicks -> {MapIndexed[{#2[[1]], #1} &, CommonName@Keys[#]], ReleaseHold[
Hold[
Part[
MapIndexed[{
Part[#2, 1], #}& ,
Map[Rotate[#, 90 Degree]& ,
Map[DateString[#, {"Month", "/", "Day"}]& ,
DateRange[
DateObject[{2020, 2, 1}], Today]]]],
Span[1, All, 10]]]]}, ReleaseHold[
Hold[ColorFunction -> "Rainbow", Mesh -> {True, False}, AspectRatio -> 1/2, ImageSize -> 600, PlotLabel -> "top 20 counties with largest confirmed cases, sorted by date of first wave\n data updated on " <> DateString[
Yesterday, "ISODate"]]]] &](https://www.wolframcloud.com/obj/resourcesystem/images/dba/dba89a96-2b3a-4254-8824-cb1f9e01a94b/161b48aa114ab289.png) |
| Out[6]= | 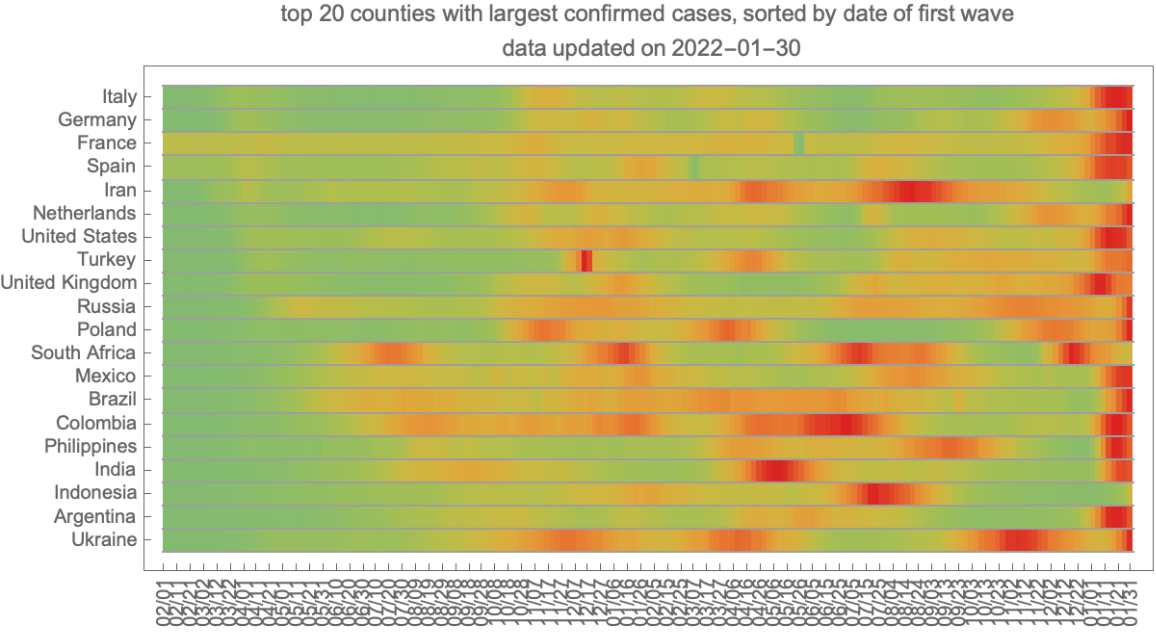 |
Estimated new cases and deaths (7 day average) in the US:
| In[7]:= | ![DateListLogPlot[ResourceData[\!\(\*
TagBox["\"\<Epidemic Data for Novel Coronavirus COVID-19\>\"",
#& ,
BoxID -> "ResourceTag-Epidemic Data for Novel Coronavirus COVID-19-Input",
AutoDelete->True]\), "WorldCountries"][
SelectFirst[#Country == Entity["Country", "UnitedStates"] &], {"ConfirmedCases", "Deaths"}][All, MovingAverage[Differences[#], Quantity[1, "Weeks"]] &], Sequence[
PlotRange -> {{{2020, 3, 1}, Automatic}, Automatic}, PlotLegends -> {"confirmed cases", "deaths"}, PlotLabel -> "estimated new cases in the US (log scale)", Filling -> {1 -> Bottom, 2 -> Bottom}, PlotMarkers -> Automatic, ImageSize -> 300, PlotRange -> Full]]](https://www.wolframcloud.com/obj/resourcesystem/images/dba/dba89a96-2b3a-4254-8824-cb1f9e01a94b/063cf67217242f63.png) |
| Out[7]= | 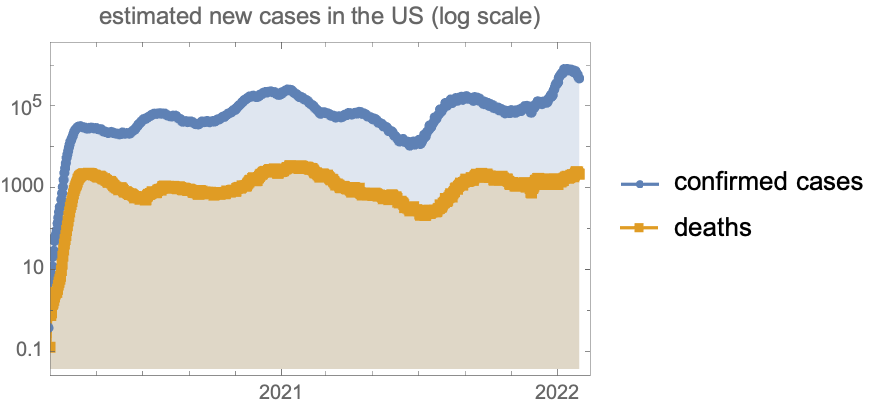 |
Color US states by the latest confirmed cases:
| In[8]:= |
| Out[8]= | 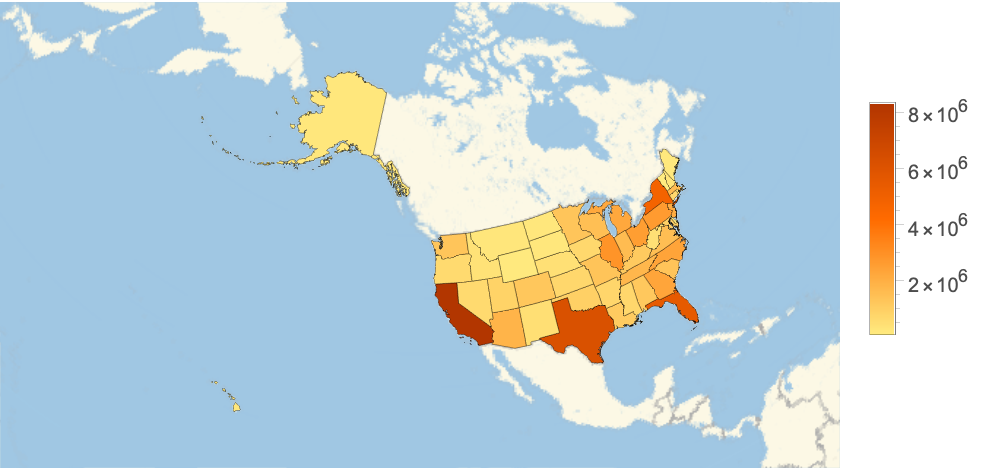 |
Explore the trend of new cases (7 day average) in each US state:
| In[9]:= | ![ResourceData[\!\(\*
TagBox["\"\<Epidemic Data for Novel Coronavirus COVID-19\>\"",
#& ,
BoxID -> "ResourceTag-Epidemic Data for Novel Coronavirus COVID-19-Input",
AutoDelete->True]\), "USStates"][All, DateListPlot[{#, MovingAverage[#, Quantity[1, "Weeks"]]} &@
TimeSeriesWindow[Differences[#ConfirmedCases], ReleaseHold[
Hold[{
DateObject[{2020, 3, 1}, "Day", "Gregorian", -5.], Yesterday}]]], Epilog -> {Text[
Style[#AdministrativeDivision[
EntityProperty["AdministrativeDivision", "StateAbbreviation"]], Bold, 11], Scaled[{.96, .96}], {1, 1}], Text[Style[ToString@#ConfirmedCases["LastValue"], 11], Scaled[{.96, .96}], {1, 3}]}, Sequence[
FrameTicks -> None, Filling -> {1 -> 0}, PlotStyle -> {
Directive[
RGBColor[1, 0, 0],
Opacity[0.01]],
Directive[
Thickness[0.01],
RGBColor[1, 0, 0]]}, PlotRange -> {0, All}, FillingStyle -> Directive[
Thickness[0.015],
Opacity[0.2]], Joined -> {False, True}, ImageSize -> Tiny]] &] // Normal // Multicolumn[#, 7] &](https://www.wolframcloud.com/obj/resourcesystem/images/dba/dba89a96-2b3a-4254-8824-cb1f9e01a94b/02a6988416ae1b3f.png) |
| Out[9]= | 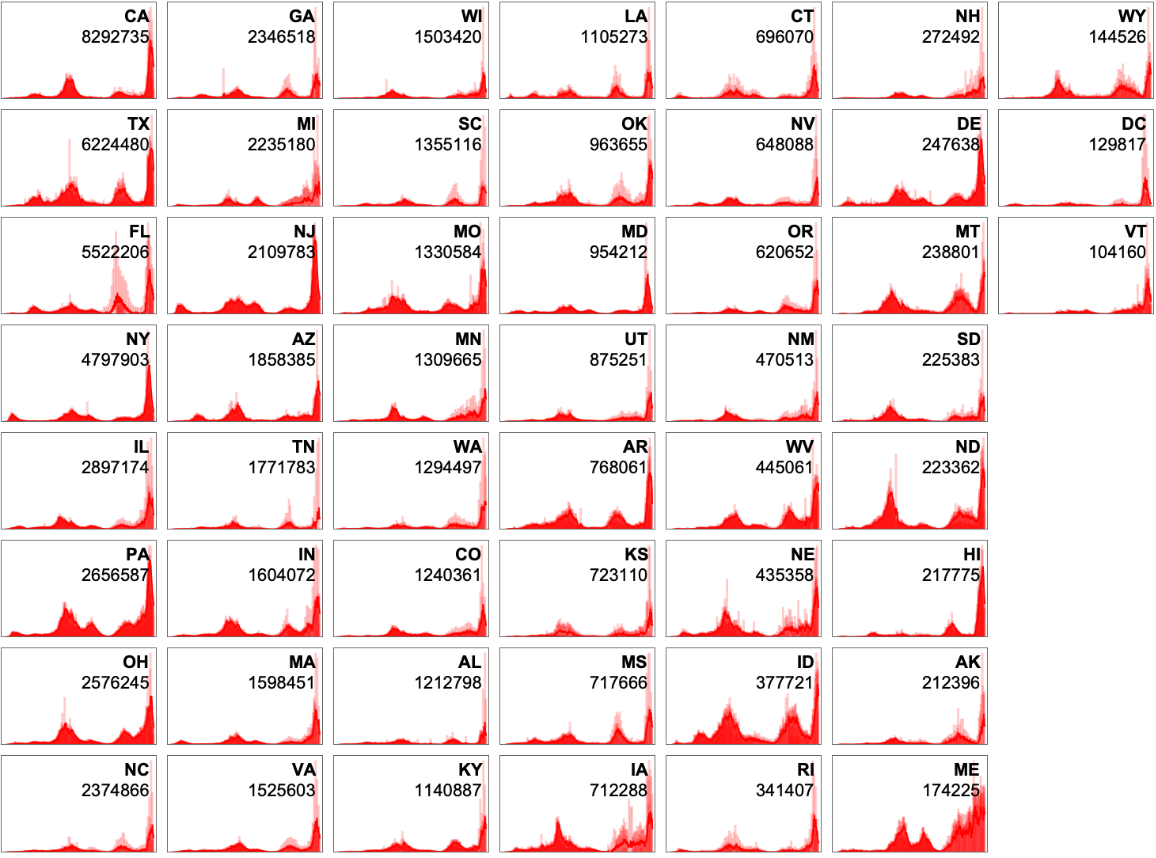 |
Retrieve the data for five most affected US counties:
| In[10]:= |
| Out[10]= | 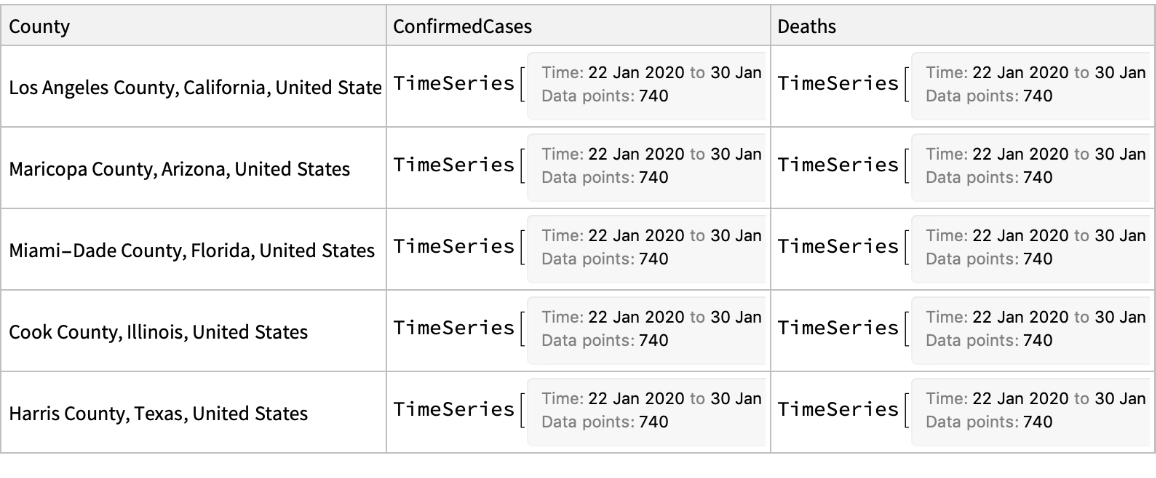 |
Color the counties of each state by the latest confirmed cases:
| In[11]:= | ![Manipulate[
GeoRegionValuePlot[
Normal@data[Select[MatchQ[state, #State] &]][
All, {#County, 10^5*#ConfirmedCases["LastValue"]/#County["Population"] /. Power["People", -1] -> IndependentUnit["per 100K people"]} &]], {state, states}, Initialization :> {data = ResourceData[\!\(\*
TagBox["\"\<Epidemic Data for Novel Coronavirus COVID-19\>\"",
#& ,
BoxID -> "ResourceTag-Epidemic Data for Novel Coronavirus COVID-19-Input",
AutoDelete->True]\), "USCounties"]; states = EntityList[
EntityClass["AdministrativeDivision", "AllUSStatesPlusDC"]]}, Sequence[
SynchronousUpdating -> False, SynchronousInitialization -> False]]](https://www.wolframcloud.com/obj/resourcesystem/images/dba/dba89a96-2b3a-4254-8824-cb1f9e01a94b/41ceae9eecb4bd00.png) |
| Out[11]= | 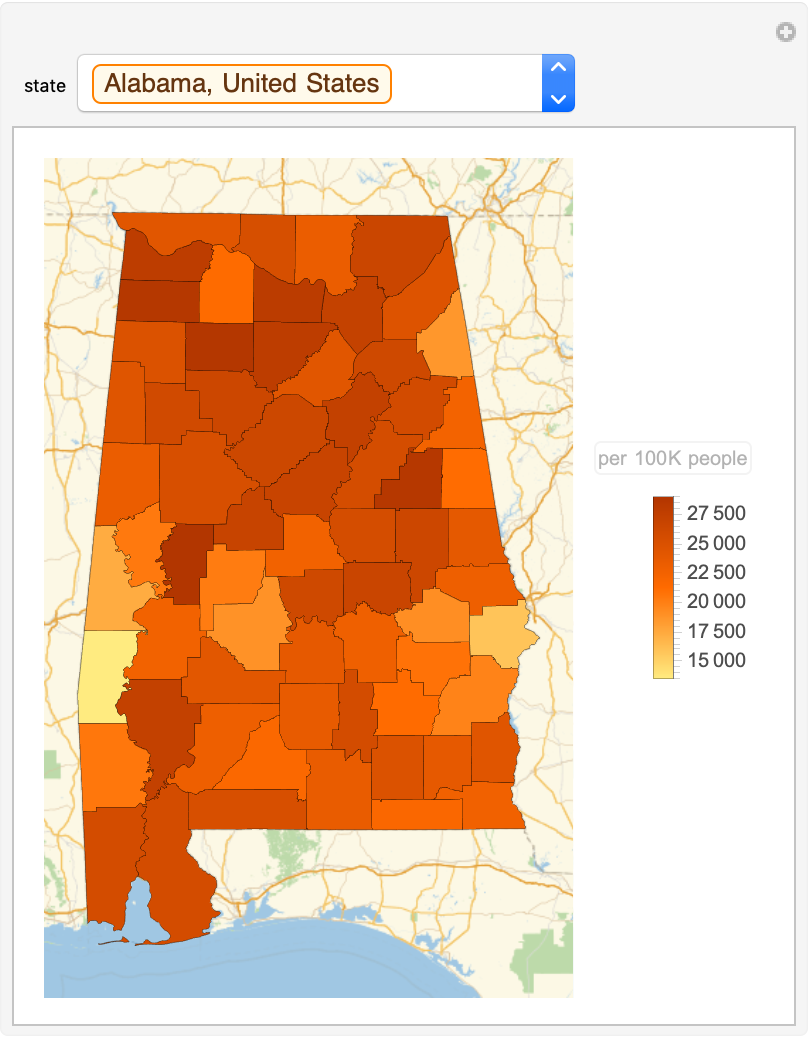 |
Wolfram Research, "Epidemic Data for Novel Coronavirus COVID-19" from the Wolfram Data Repository (2022) https://doi.org/10.24097/wolfram.04123.data