Wolfram Data Repository
Immediate Computable Access to Curated Contributed Data
Protein sequences of the SARS-CoV-2 virus (the virus associated with the COVID-19 disease, formerly known as 2019-nCoV) including location, collection time and similar supporting data
| "LatestData" | a Dataset containing the most recently collected data |
| "CollectionHistogram" | a DateHistogram of when the sequences were collected |
| "ReleaseHistogram" | a DateHistogram of when the sequences were released to the public |
| "AffectedLocations" | a world map showing where these sequences were collected |
| “SubmissionAuthors” | a Dataset containing the accessions for each author list |
Get a Dataset containing rows for the most recently released sequences:
| In[1]:= |
| Out[1]= | 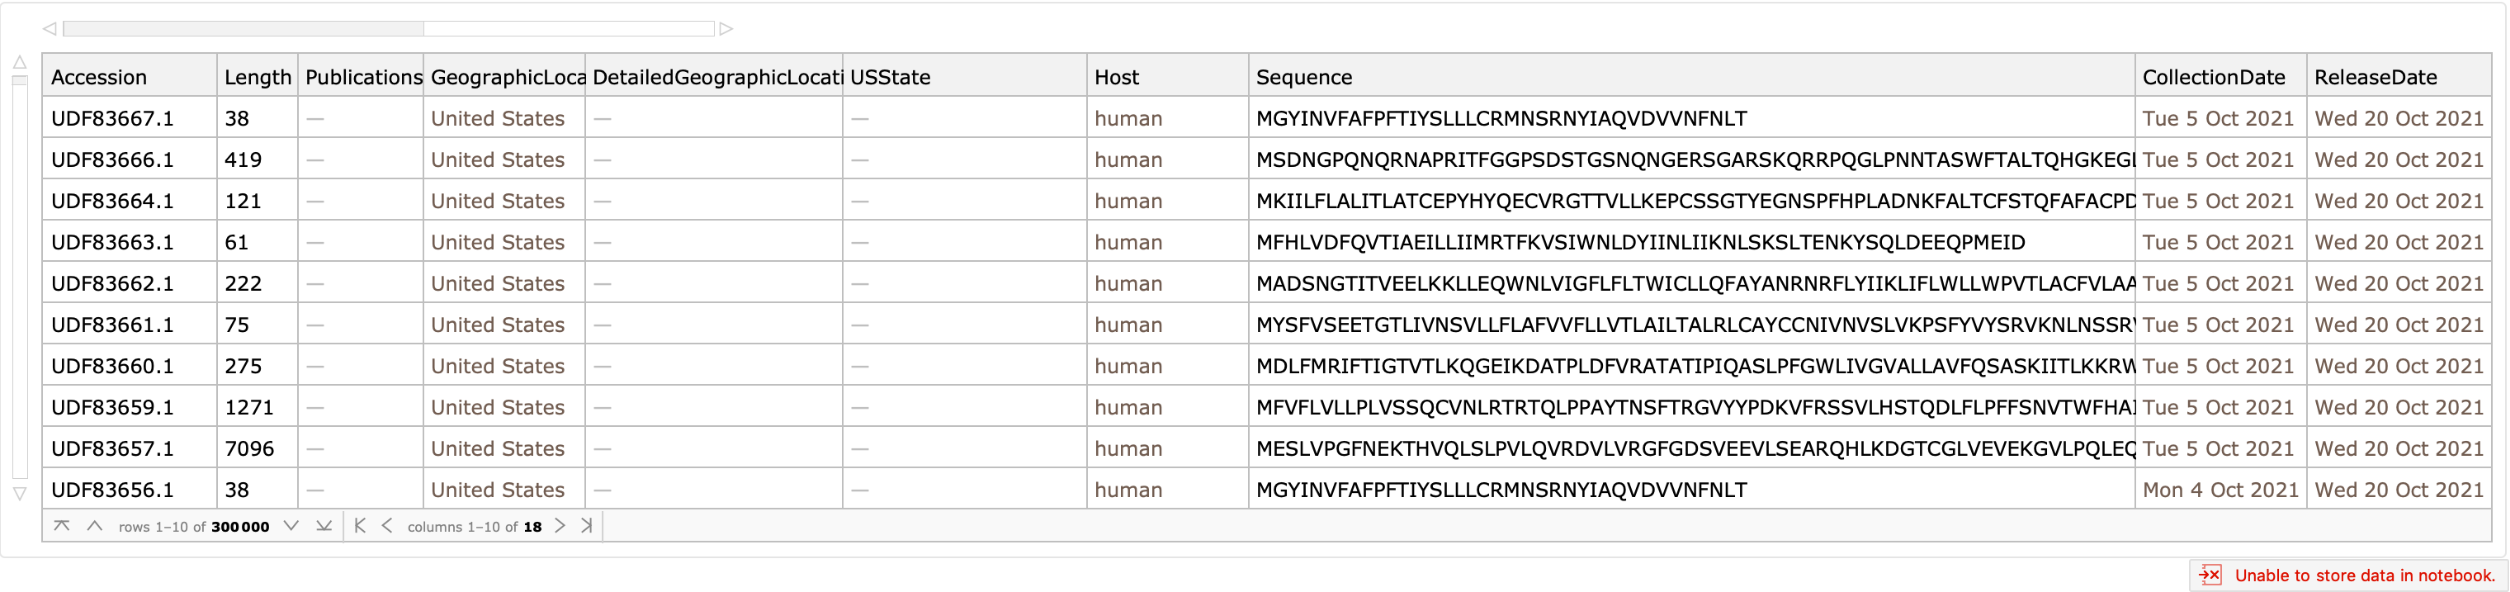 |
Obtain the the number of rows for all sequences (the first call for all sequences can take some time):
| In[2]:= |
| Out[2]= |
Return the latest date a sequence was released:
| In[3]:= |
| Out[3]= |
Count proteins by the reported description:
| In[4]:= |
| Out[4]= | 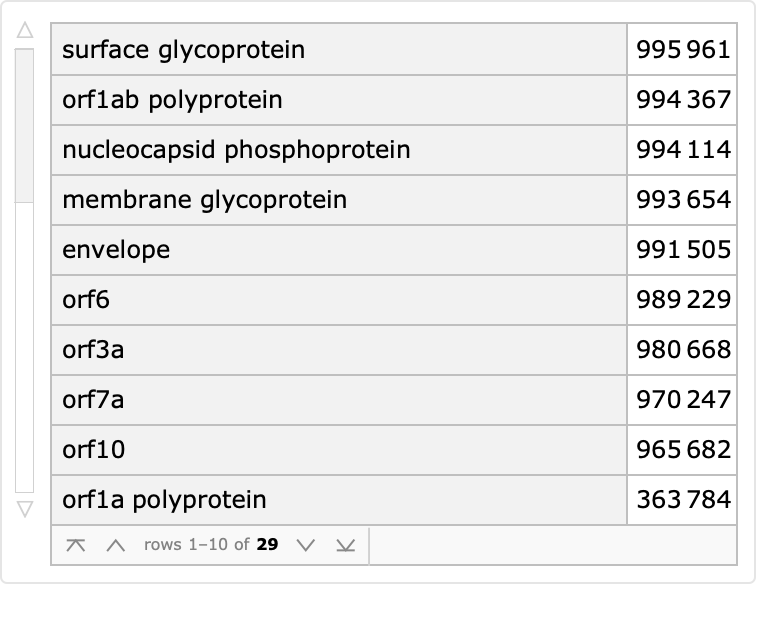 |
Most of these protein sequences are collected from humans, but not all:
| In[5]:= | ![ReverseSort[
ResourceData["Protein Sequences for the SARS-CoV-2 Coronavirus"][
Select[Not[MissingQ[#Host]] &]][Counts, "Host"]]](https://www.wolframcloud.com/obj/resourcesystem/images/f30/f303ad23-93f5-4f54-9748-1e8ca4b820b3/04745e7642383ae7.png) |
| Out[5]= | 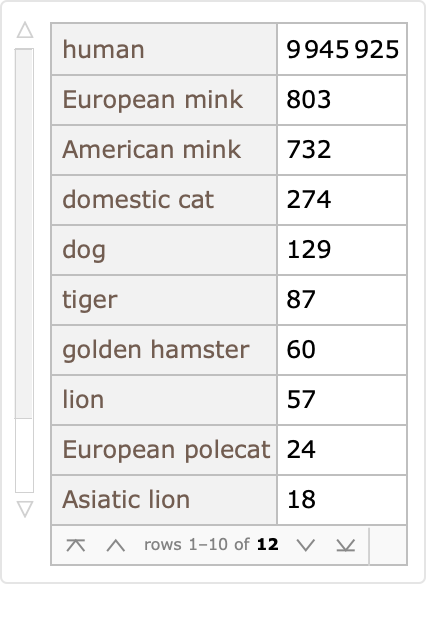 |
Some of these protein sequences correspond to named variations of interest as designated by the World Health Organization (WHO):
| In[6]:= | ![ReverseSort[
ResourceData["Protein Sequences for the SARS-CoV-2 Coronavirus"][
Select[Not[MissingQ[#WHONamedVariant]] &]][Counts, "WHONamedVariant"]]](https://www.wolframcloud.com/obj/resourcesystem/images/f30/f303ad23-93f5-4f54-9748-1e8ca4b820b3/45ab96d958a2a791.png) |
| Out[6]= | 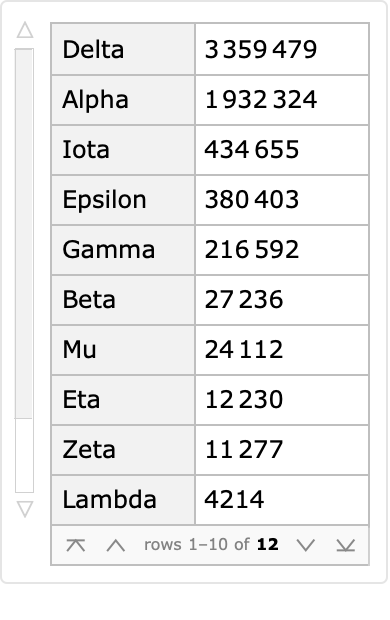 |
Get a date plot of collection dates:
| In[7]:= |
| Out[7]= | 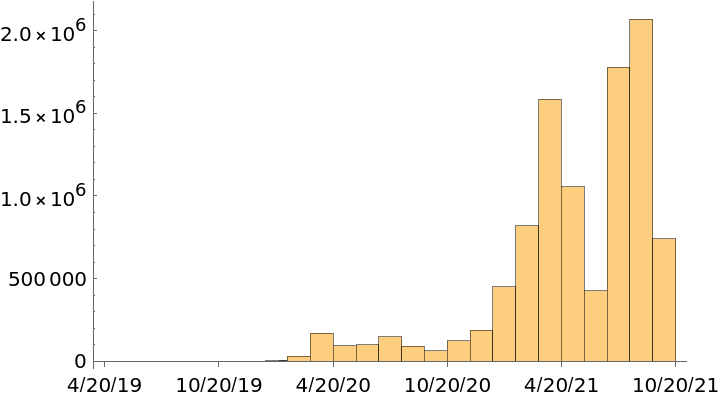 |
See a data histogram of release dates:
| In[8]:= |
| Out[8]= | 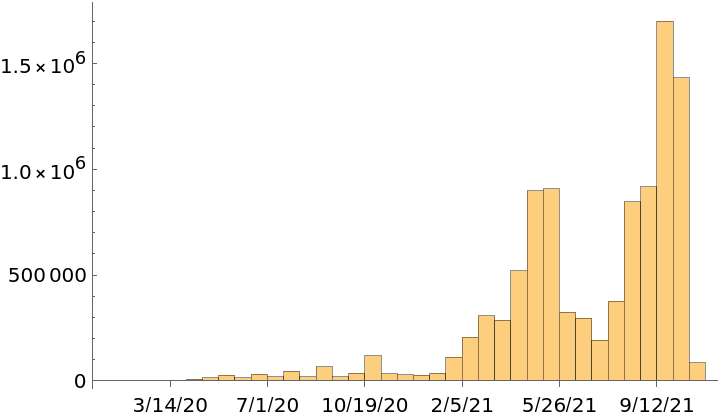 |
Show the locations where the sequences were gathered:
| In[9]:= |
| Out[9]= | 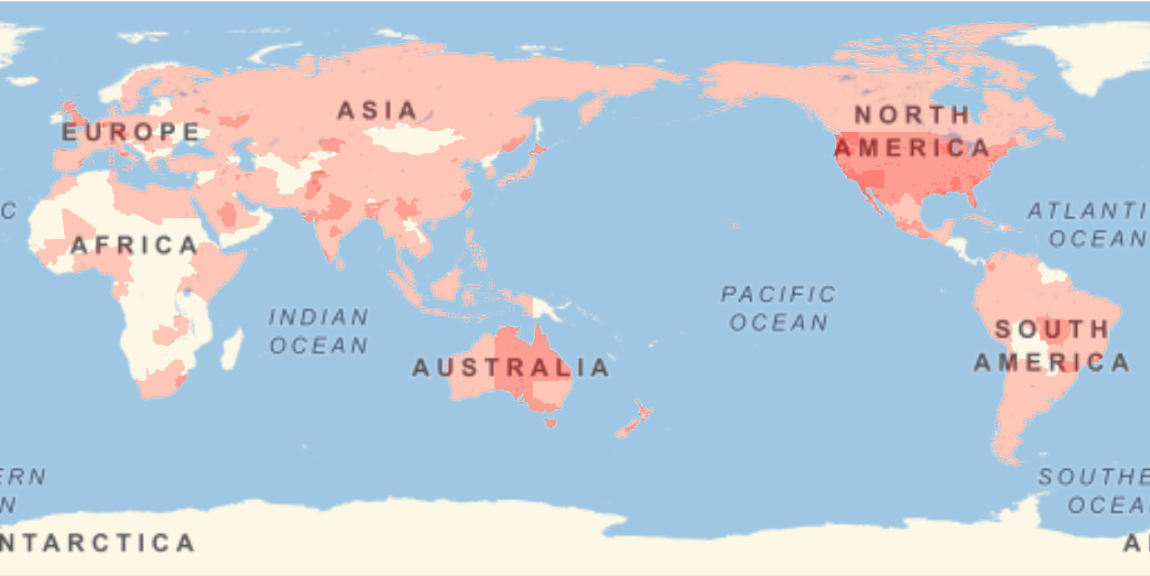 |
Obtain which accessions were provided by each submitter:
| In[10]:= |
| Out[10]= | 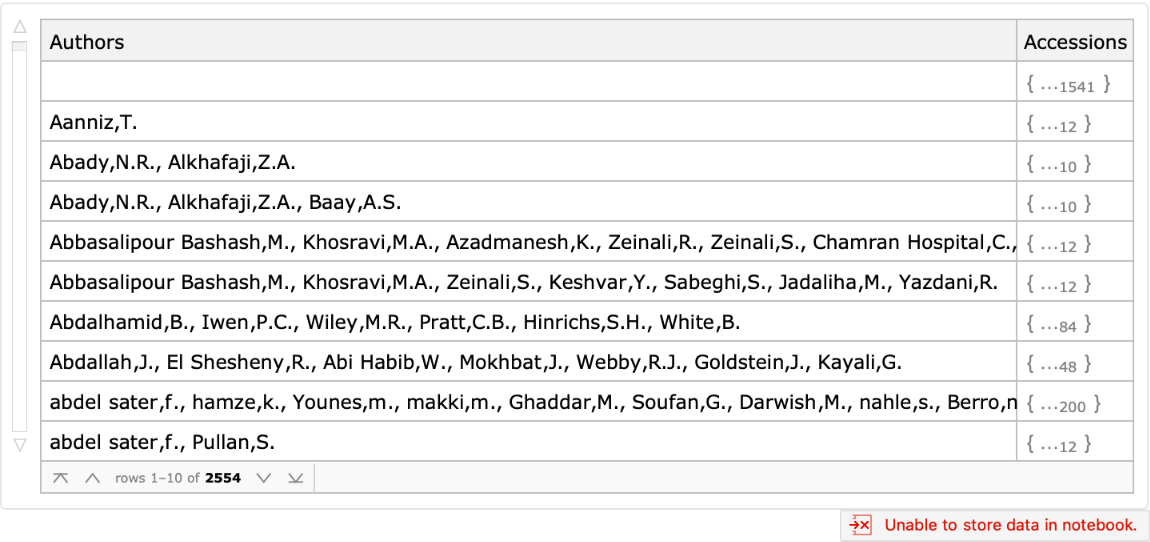 |
Most of the provided protein sequences come from the United States and Australia:
| In[11]:= | ![BarChart[Take[
Sort[ResourceData[
"Protein Sequences for the SARS-CoV-2 Coronavirus"][
Select[Not[MissingQ[#GeographicLocation]] &]][Counts, "GeographicLocation"]], -20], ChartLabels -> Automatic, BarOrigin -> Left, ImageSize -> 700]](https://www.wolframcloud.com/obj/resourcesystem/images/f30/f303ad23-93f5-4f54-9748-1e8ca4b820b3/4fd426dc27fbc8ad.png) |
| Out[11]= | 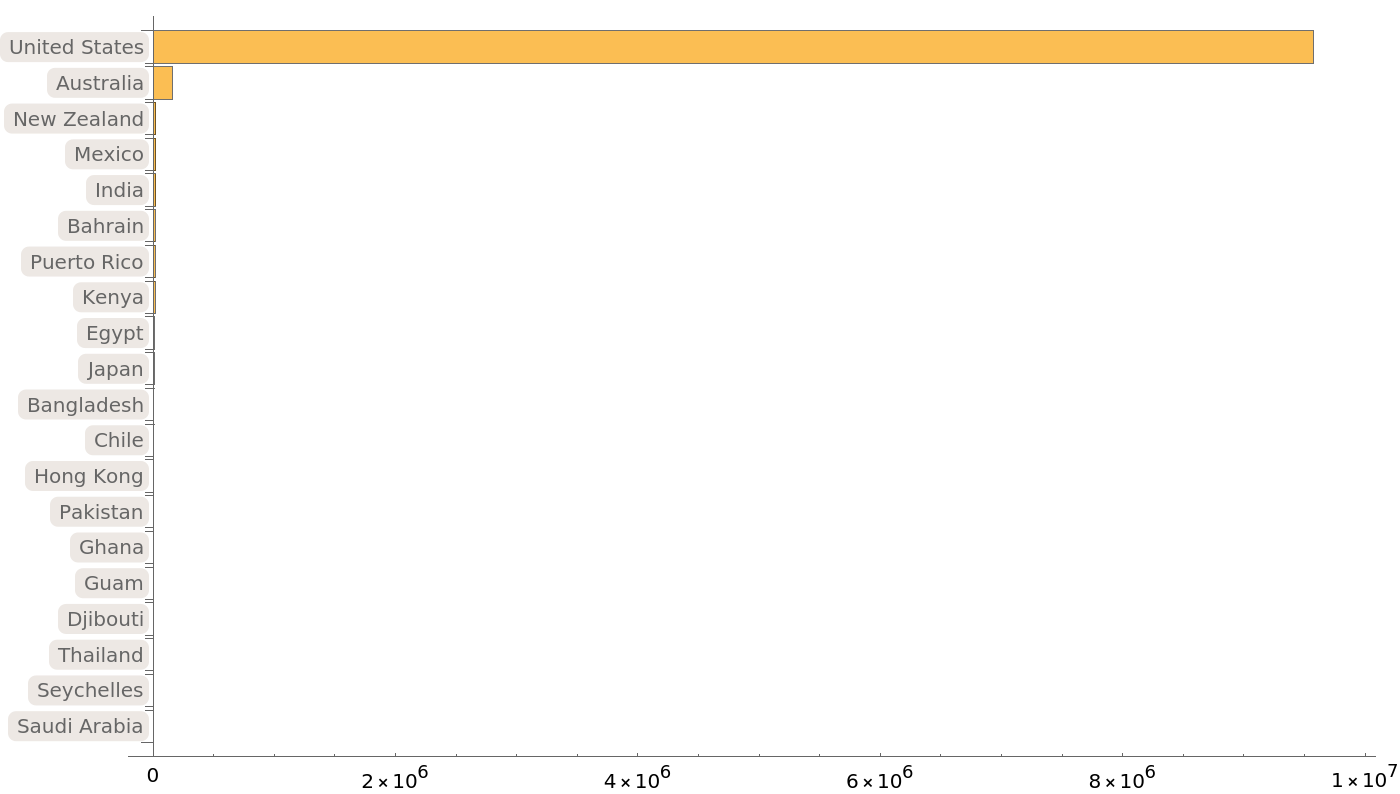 |
When we look at the geographic locations providing protein sequences with the most common title, “surface glycoprotein”, these proportions are largely maintained:
| In[12]:= | ![BarChart[Take[
Sort[ResourceData[
"Protein Sequences for the SARS-CoV-2 Coronavirus"][
Select[
And[Not[MissingQ[#GeographicLocation]], #Protein === "surface glycoprotein"] &]][
Counts, "GeographicLocation"]], -20],
ChartLabels -> Automatic, BarOrigin -> Left, ImageSize -> 700]](https://www.wolframcloud.com/obj/resourcesystem/images/f30/f303ad23-93f5-4f54-9748-1e8ca4b820b3/55cf05e241adfa57.png) |
| Out[12]= | 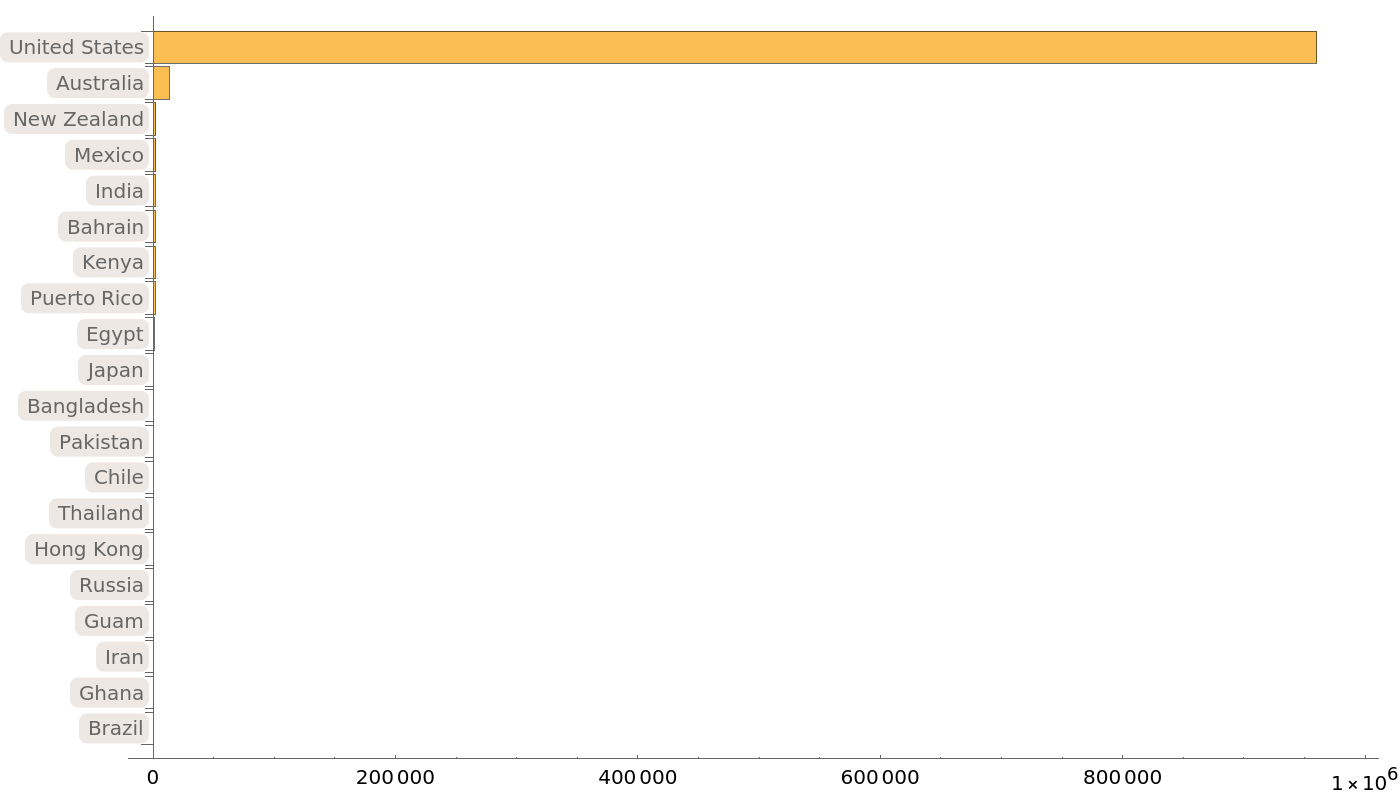 |
Most of the provided sequences come from regions in the Unites States and Australia:
| In[13]:= | ![BarChart[Take[
Sort[ResourceData[
"Protein Sequences for the SARS-CoV-2 Coronavirus"][
Select[Not[MissingQ[#DetailedGeographicLocation]] &]][Counts, "DetailedGeographicLocation"]], -20], ChartLabels -> Automatic, BarOrigin -> Left, ImageSize -> 700]](https://www.wolframcloud.com/obj/resourcesystem/images/f30/f303ad23-93f5-4f54-9748-1e8ca4b820b3/5115ebedc3793743.png) |
| Out[13]= | 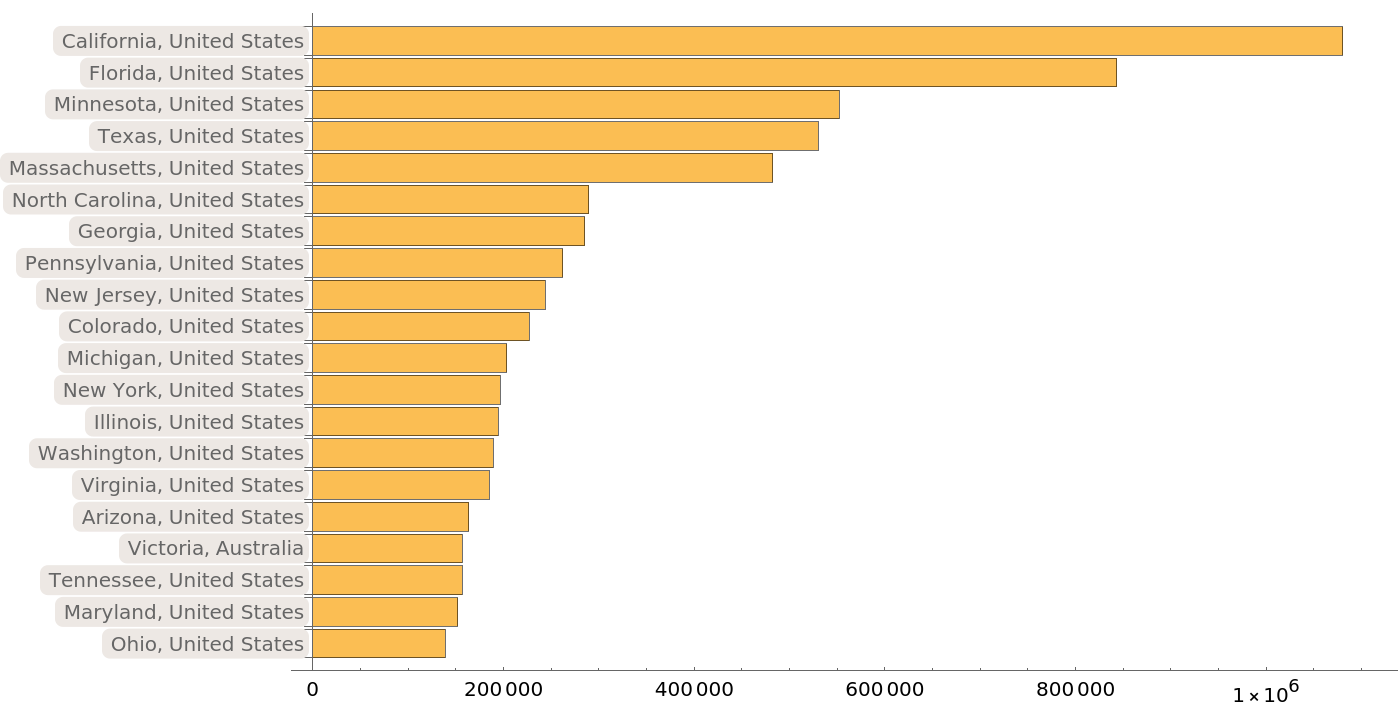 |
When we look at the detailed geographic locations providing protein sequences with the most common title, “surface glycoprotein”, these proportions are again largely maintained:
| In[14]:= | ![BarChart[Take[
Sort[ResourceData[
"Protein Sequences for the SARS-CoV-2 Coronavirus"][
Select[And[#Protein === "surface glycoprotein", Not[MissingQ[#DetailedGeographicLocation]]] &]][Counts, "DetailedGeographicLocation"]], -20], ChartLabels -> Automatic, BarOrigin -> Left, ImageSize -> 700]](https://www.wolframcloud.com/obj/resourcesystem/images/f30/f303ad23-93f5-4f54-9748-1e8ca4b820b3/2135f62f5411c628.png) |
| Out[14]= | 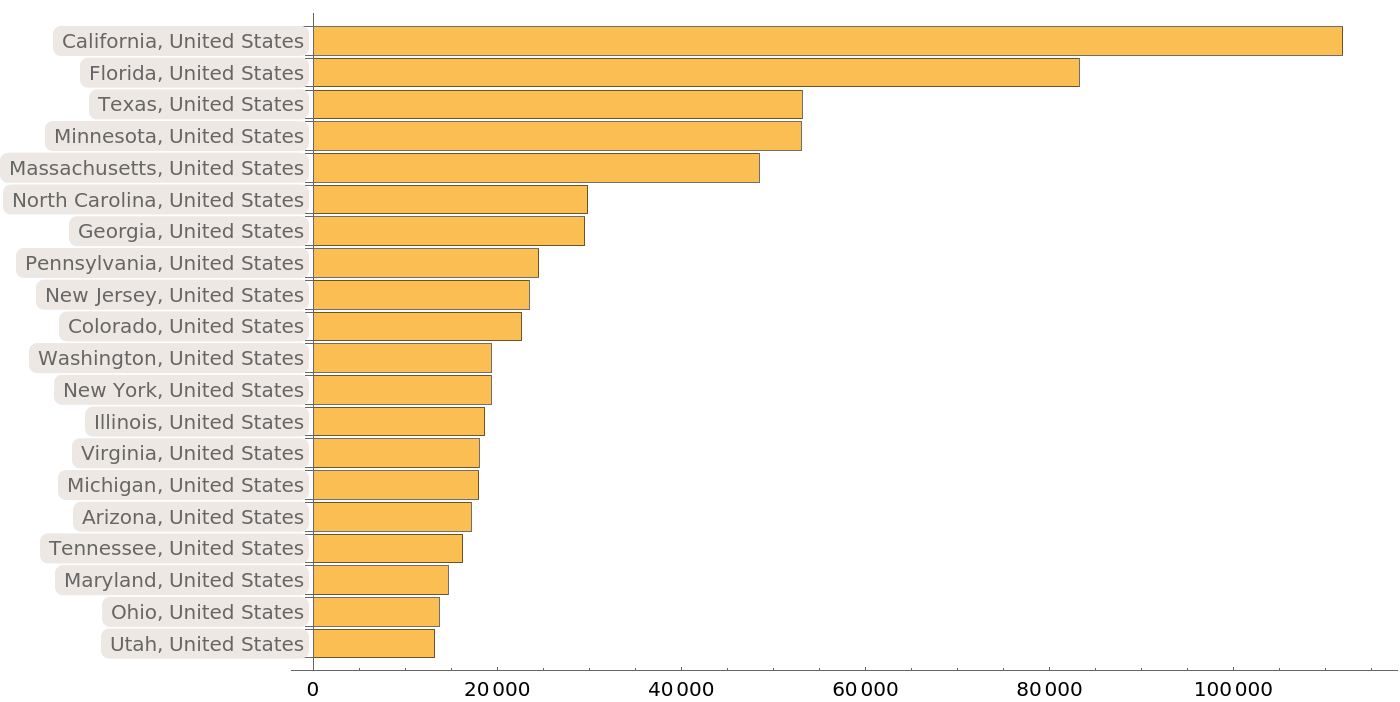 |
By gathering all of the titles by their protein label, we can see that the same proteins are submitted under a wide variety of names:
| In[15]:= | ![processProteinLabel[
proteinLabel_String] := (processProteinLabel[proteinLabel] = Module[{prot = proteinLabel},
If[StringStartsQ[prot, "RecName:"],
prot = StringCases[prot, StartOfString ~~ "RecName: Full=" ~~ Shortest[fulltitle___] ~~
";" | EndOfString :> StringTrim[fulltitle]][[1]]
];
StringTrim@
StringReplace[StringTrim@ToLowerCase[prot], {
"membrance" -> "membrane", "2019-ncov s2 subunit,2019-ncov s2 subunit" -> "2019-ncov s2 subunit", "proteiin" -> "protein", ", partial" -> "", StringExpression["[",
BlankNullSequence[], "]"] -> "", "-" -> "", "," -> "", StringExpression[WordBoundary, "protein", WordBoundary] -> "",
"partial" -> "", StringExpression[
"chain ", WordCharacter, WordBoundary] -> ""}]]);
refseqs = DeleteDuplicates@
ResourceData["Protein Sequences for the SARS-CoV-2 Coronavirus"][
Select[#SequenceType == "RefSeq" &], {"Protein", "Sequence"}];
Dataset[Table[
<|"NCBI Protein Label" -> s[[1]], "Submitted Names" -> DeleteDuplicatesBy[
Union[processProteinLabel /@ DeleteMissing[
Normal@ResourceData[
"Protein Sequences for the SARS-CoV-2 Coronavirus"][Select[
Or[#Protein == s[[1]], #Sequence == s[[2]]]
&], "GenBankTitle"]]],
ToLowerCase]
|>
, {s, Normal[refseqs]}
]
][ReverseSortBy[Length[#"Submitted Names"] &]]](https://www.wolframcloud.com/obj/resourcesystem/images/f30/f303ad23-93f5-4f54-9748-1e8ca4b820b3/7fc882d68020f316.png) |
| Out[16]= | 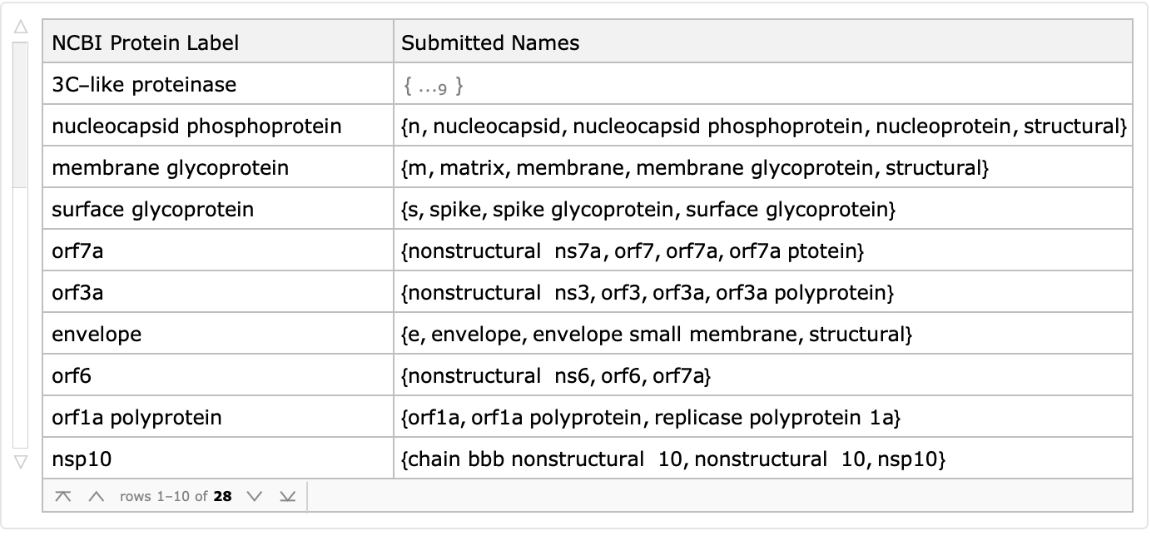 |
We can plot where these proteins are found along the reference SARS-CoV-2 genome. To properly find an alignment, we align the protein reference sequences with the translation of each potential frame shift and choose the best alignment:
| In[17]:= | ![originalReferenceSequence = ResourceData["Genetic Sequences for the SARS-CoV-2 Coronavirus", "ReferenceBioSequence"];
translateDNASeqWithOffset[seq_BioSequence, offset_] := BioSequenceTranslate[
BioSequenceModify[StringDrop[seq, offset], "DropIncompleteCodons"]];
shiftTranslations = translateDNASeqWithOffset[originalReferenceSequence, #] & /@ Range[0, 2];
extractAligningRange[alignment : {__}] := Module[{workingAlignment, startCoord, endCoord},
If[MatchQ[Last[alignment], {_, ""}],
workingAlignment = Most[alignment],
workingAlignment = alignment
];
If[MatchQ[First[workingAlignment], {_, ""}],
startCoord = StringLength[workingAlignment[[1, 1]]] + 1;
workingAlignment = Rest[workingAlignment],
startCoord = 1
];
endCoord = Total[StringLength[If[StringQ[#], #, First[#]]] & /@ workingAlignment] + startCoord - 1;
{startCoord, endCoord}
];
localLength[alignment_List] := Max[StringLength[StringJoin[Last /@ Select[alignment, ListQ]]],
StringLength[
StringJoin[First /@ Select[alignment[[2 ;; -2]], ListQ]]]];
findAligningRangeFromTranslations[seq_] := Module[{alignments, bestShiftPos, localLengths},
alignments = SequenceAlignment[#, seq, Method -> "Local"] & /@ shiftTranslations;
localLengths = localLength /@ alignments;
bestShiftPos = First[Ordering[localLengths]];
If[localLengths[[bestShiftPos]]/StringLength[seq] < 0.1,
((extractAligningRange[alignments[[bestShiftPos]]] + bestShiftPos - 1)*3) - 2,
None
]
];
alignmentRanges = SortBy[DeleteCases[{#[[1]], findAligningRangeFromTranslations[#[[2]]]} & /@ Values[Normal@refseqs], {_, None}], MinMax[Last[#]] &];
Column[Map[Function[{plotBatch},
NumberLinePlot[Reverse[Interval /@ plotBatch[[All, 2]]], PlotLegends -> Reverse[plotBatch[[All, 1]]], PlotRange -> {1, 29903}, ImageSize -> 400, AxesLabel -> "base pairs"]
],
Partition[alignmentRanges, UpTo[8]]
]]](https://www.wolframcloud.com/obj/resourcesystem/images/f30/f303ad23-93f5-4f54-9748-1e8ca4b820b3/609e0c4bb09a4797.png) |
| Out[24]= | 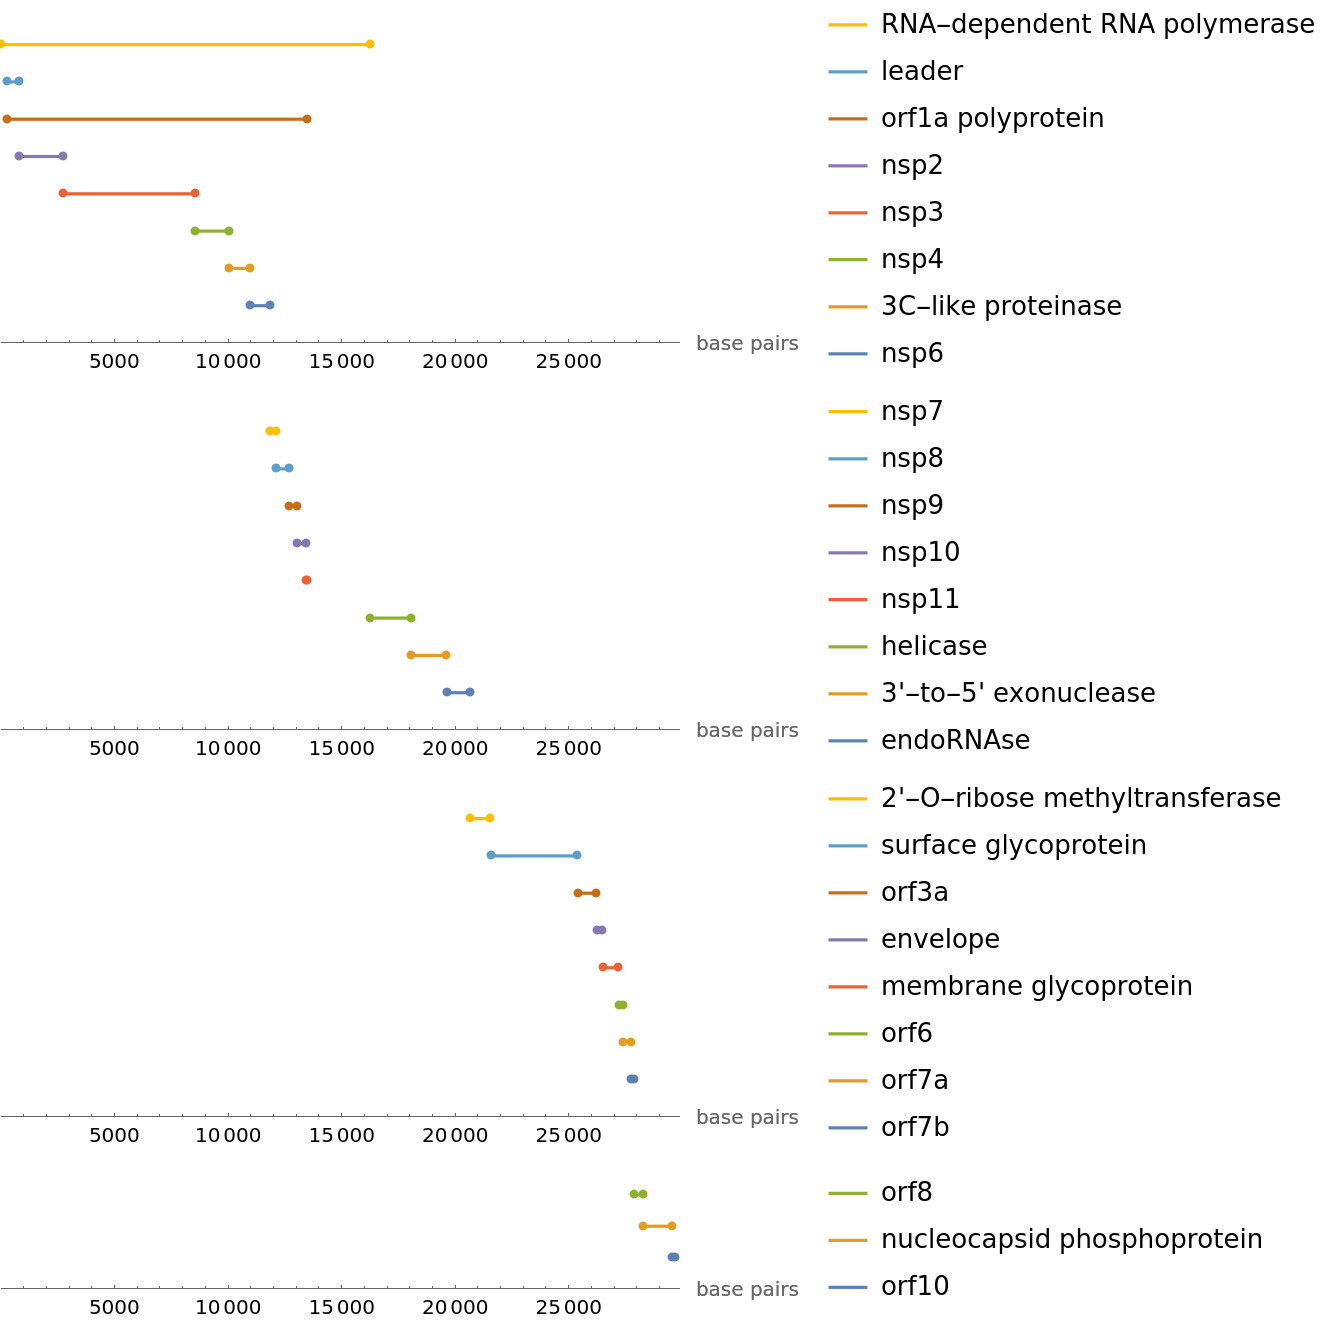 |
Wolfram Research, "Protein Sequences for the SARS-CoV-2 Coronavirus" from the Wolfram Data Repository (2021)
Public Domain